Part II: Settings and Measurements
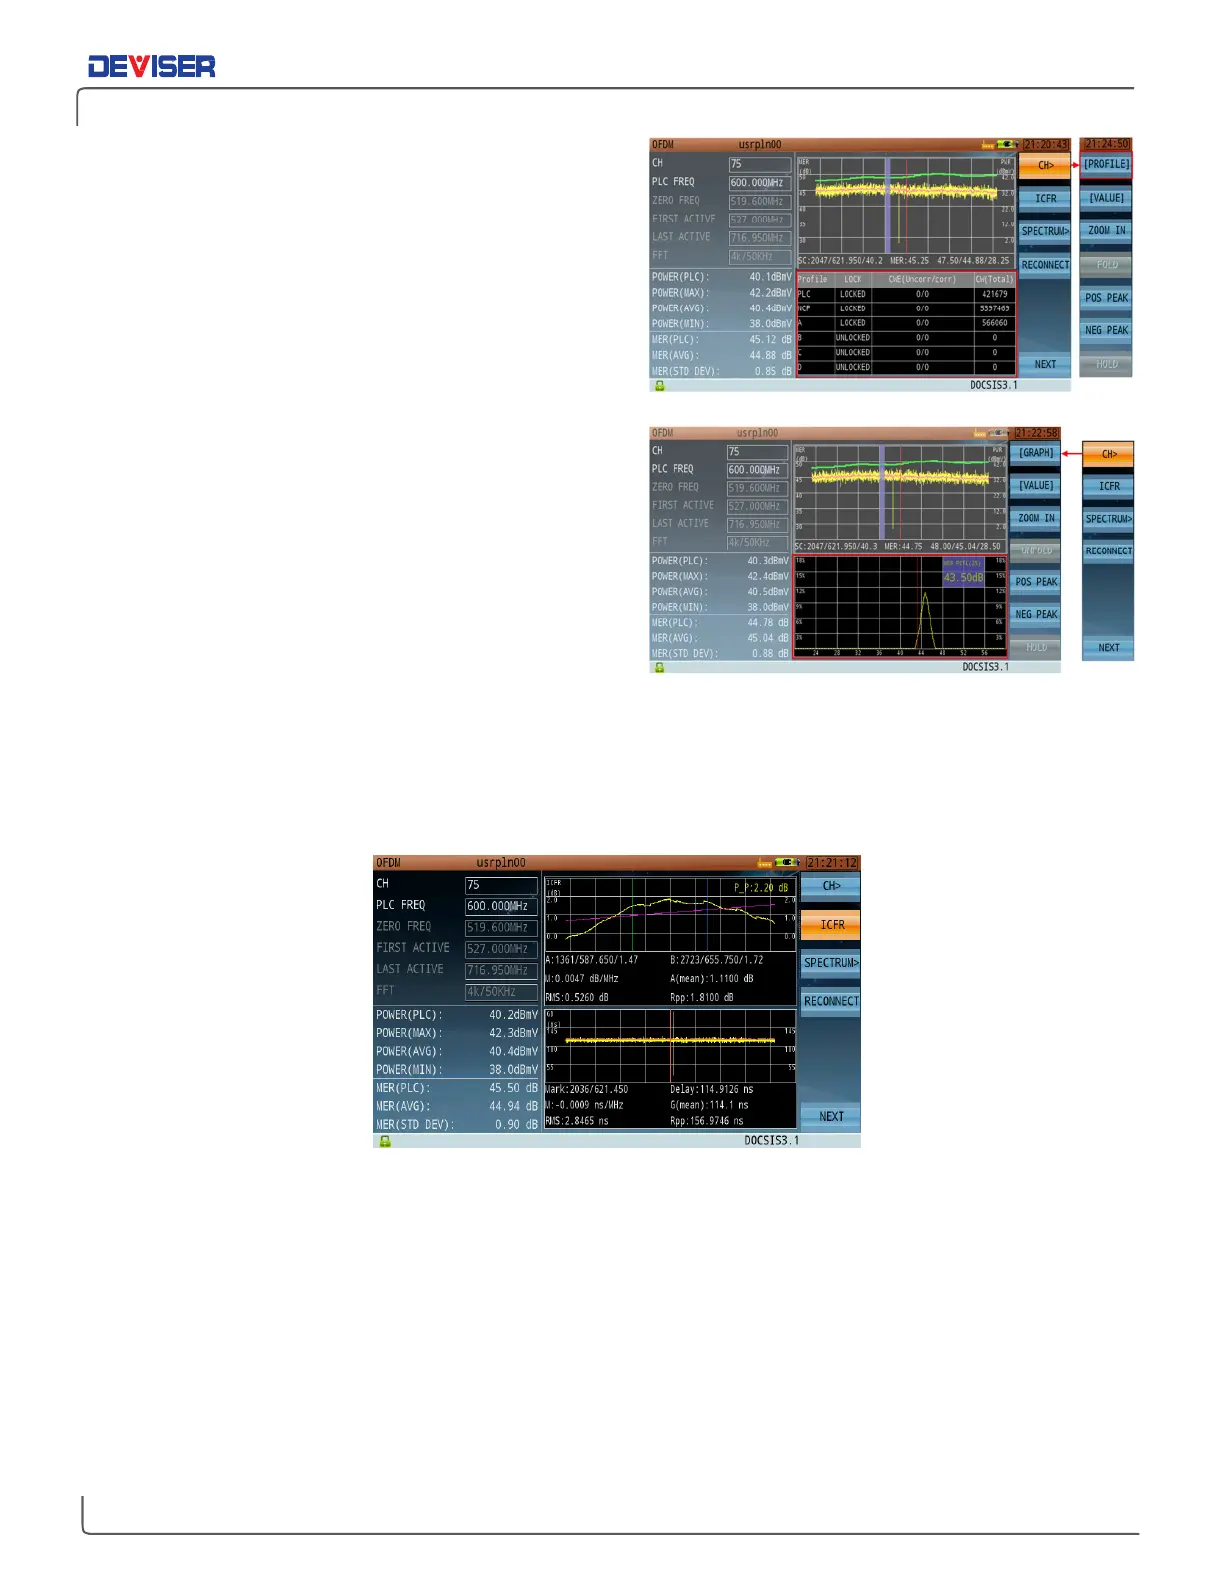
In the
CH>
(F1) menu, enter Profile view to see the
profile information table (shown, right).
This table shows the status of NCP, PLC, & profiles A, B,
C, and D; as well as bit error rate statistics.
In the same menu, enter Graph view to see the carrier
MER distribution graph. This graph shows the ratio of
[occurrences of all MER values across all carriers] :
[total number of carriers].
As shown, most carriers measure at 44~48dB MER.
Among these, about 98% of carriers measure >45.25dB.
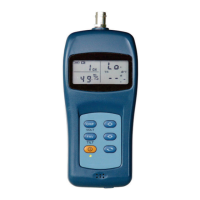
23-2 OFDM In-Band Frequency Response
From the main OFDM menu, press
ICFR
(F2) to enter ICFR mode.
In this mode, you can view in-band frequency response curves and group time-delay curves individually, in
order to determine whether the current signal transmission meets design requirements. If the ICFR values
fluctuate too widely over time, there may be a problem with the cable, connectors, or other components.