Part III: Background and Concepts
Application Note: A Study of Digital Persistence Analysis
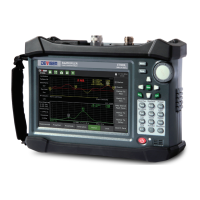
The DS2831 is a new-generation True Spectrum Analyzer that, among other powerful features and functions,
incorporates “Spectrum Persistence” analysis. This measurement enables in-service detection of undesirable
transient noise and impairments – both linear and non-linear. These impairments often hide under upstream
bursty signal transmissions, like bonded DOCSIS 3 upstream channels or a fully-loaded DOCSIS 3.1 upstream
bursty carrier.
†
Traditional troubleshooting methods for upstream interference involve looking at a region of un-occupied
upstream spectrum, placing your spectrum analyzer in peak hold mode, and hoping to capture anything
of significance (or using other features, like minimum hold). But with the introduction of DOCSIS 3.0, the
upstream path has become extremely crowded. This makes it difficult to distinguish interfering signals from
“good” upstream transmission signals. With its easy-to-use features and color-coded display, the DS2831's
spectrum persistence analysis tool greatly simplifies the task of finding linear and non-linear impairments
such as CPD and impulse noise.
Spectrum Persistence testing actually captures undesirable impulse noise (in between upstream bonded
bursty DOCSIS transmissions) by capturing all of the RF energy being transmitted together in a specific,
customizable time period, usually 1000ms to 2000ms long. The instrument examines the RF energy as a
whole, and displays it as a series of bitmap points rather than a trace. In other words, it is a graphical
representation of RF energy: a bitmap where the color of each pixel indicates the amount of RF signal
occupation there. Greater signal presence indicates heavier RF density over that location, translated into
“hot” colors (red and yellow). “Cool” colors (blue) mark areas of lower signal presence.
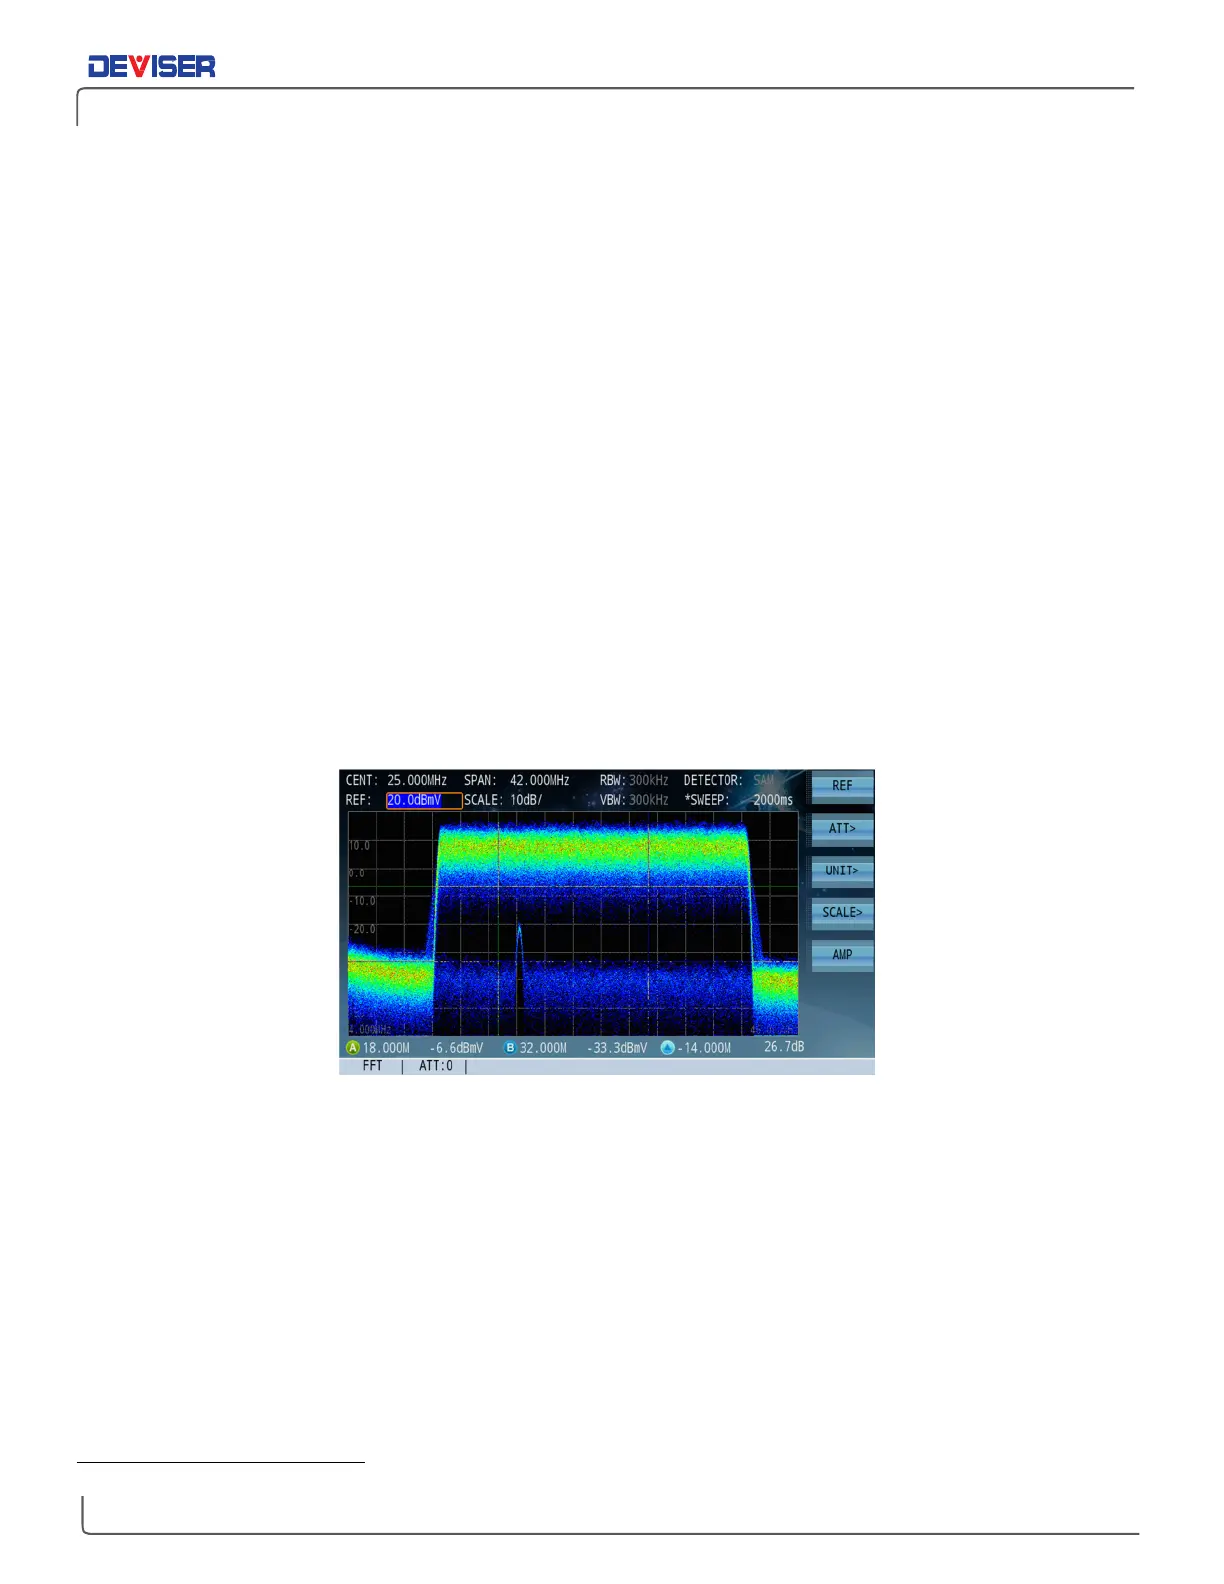
The figure above represents a loaded Upstream DOCSIS 3.1 transmission. The difference in signal presence is
clear. The colors assigned to bitmap points across the captures band are “hotter” as more signal presence
is detected. (Up to 200 MHz can be set to capture in this mode.) Note that, in this example, the internal pre-
amplifier is off, and the noise floor is at about -45dBmV (+15dBuV). Turning on the pre-amp would provide
an additional 18dB of sensitivity. You can also see how easily the DS2831 will pick up a coherent distortion
hiding under this large transmission.
†
This chapter originally written and edited by Bernie Cadieux, North American Sales, Deviser Instruments.