Curve mode
The curve mode is the standard default Spectrum
Analysis mode
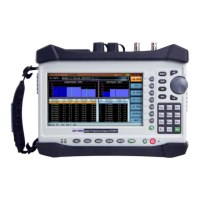
Solid mode
The solid mode fills the area below the signal with solid
yellow, shown left.
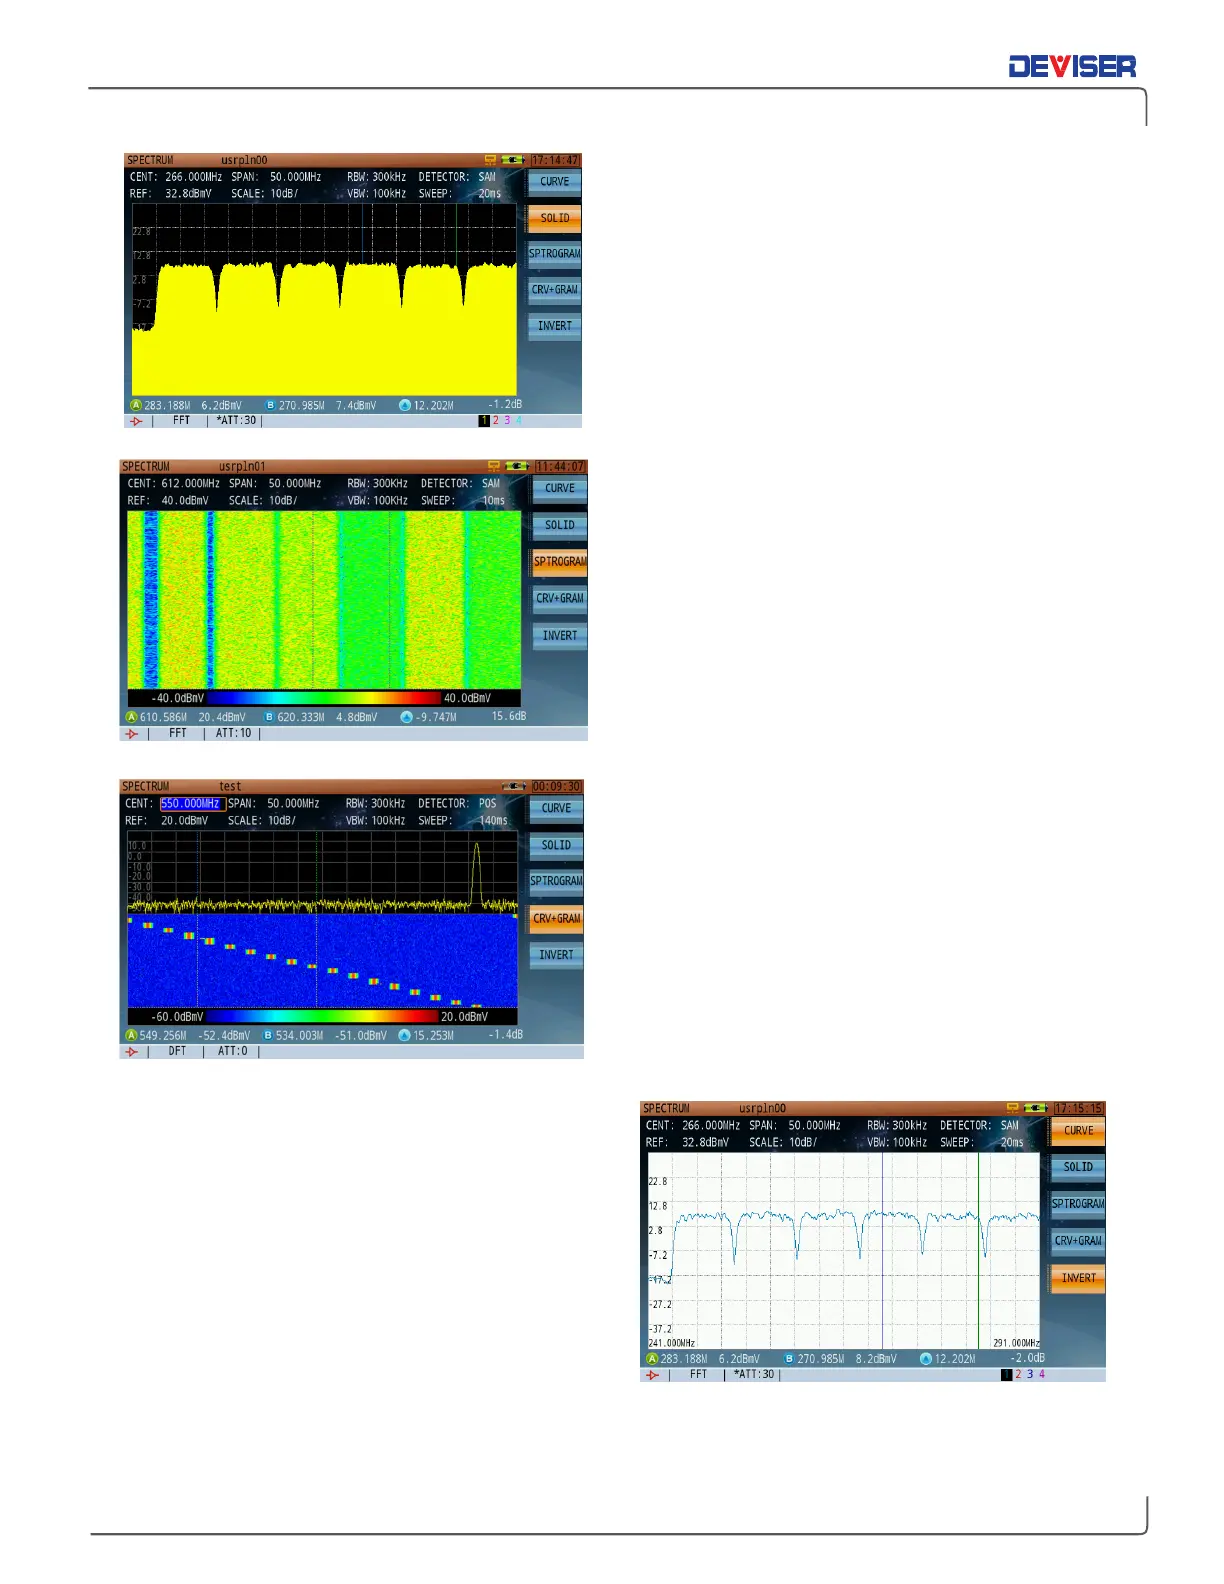
Spectrogram mode
The scrolling three-dimensional display is useful for its
ability to track frequency and power behavior over
time, particularly intermittent signals. You can use the
spectrogram mode to analyze the stability of a signal
over time, or to identify intermittent interference
signals. The X-axis (horizontal) represents frequency,
amplitude is represented by color, (red for a high level
signal and blue for the noise floor). The Y-axis (vertical)
represents time, with the most recent trace acquisition
displayed at the bottom of the graph to the oldest
acquisition at the top of the graph. (upwards
movement of acquisitions)
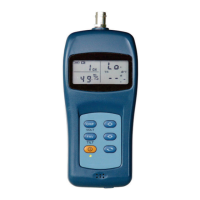
Curve+Spectrogram mode
The best setting for many scenarios, the simultaneous
spectrum trace and scrolling three-dimensional display
provides a definite advantage in using the combined
mode from a visual stand-point. (It will be much easier
to visualize signal variations, such as a hopping
frequency signal.)
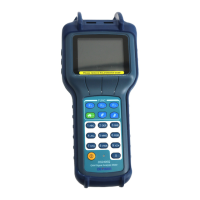
Print Mode
New to the DS2831 is Print mode. By inverting the
screen colors from dark background and a light trace
color to a light background and a dark trace color,
printing hard copies of saved traces is more cost-
efficient. This mode also makes traces easier to see in
strong sunlight.