XDSL Testing and Loop Qualification
DSL Modem Test
5
5-19
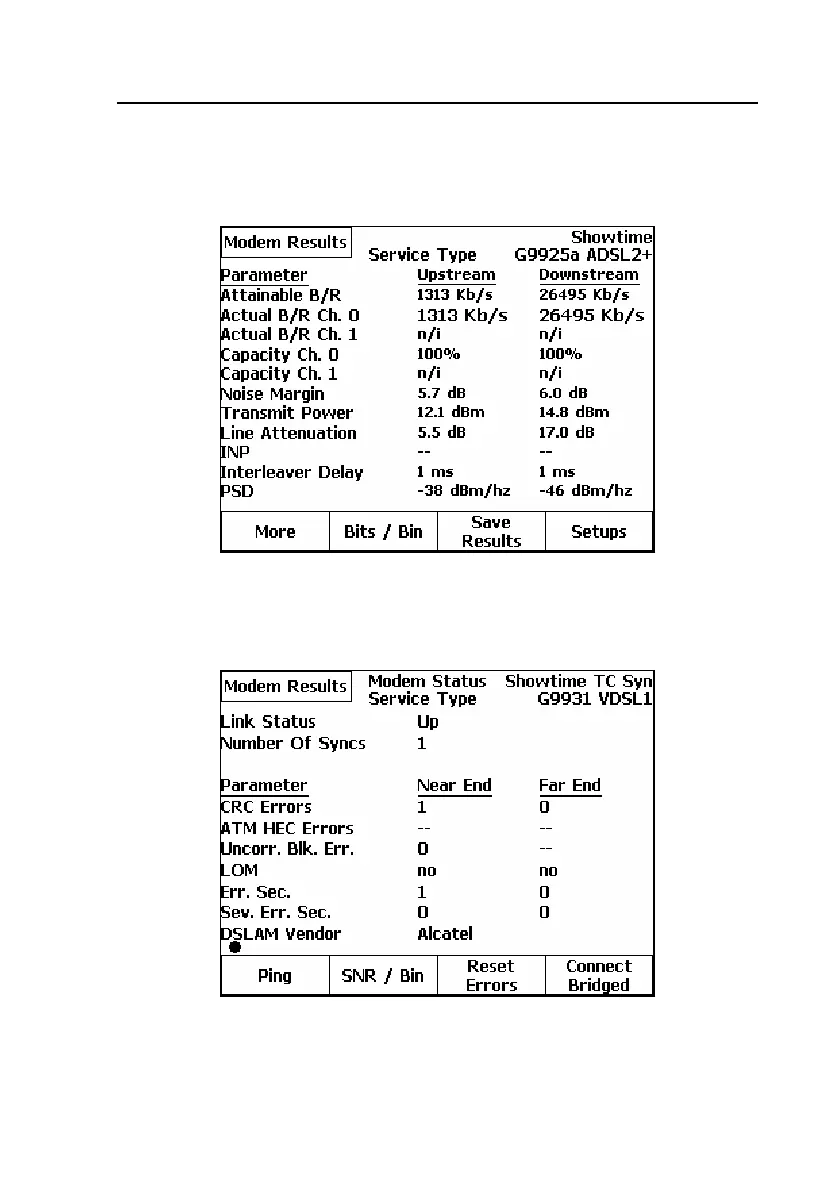
Figure 5-9 shows the primary
Modem Results screen for a typical test on an
ADSL2+ line. Figures 5-10 and 5-11 show the secondary
Modem Results
screen and the
Bits/Bin graph for a typical test on a VDSL1.5 line.
fcw01s.bmp
Figure 5-9. DSL Modem Test Primary Results Screen: ADSL2+ Line
fcw02s.bmp
Figure 5-10. DSL Modem Test Secondary Results Screen: VDSL1.5 Line