TDR Testing and Fault Location
The TDR Toolbox
6
6-13
acy73s.eps
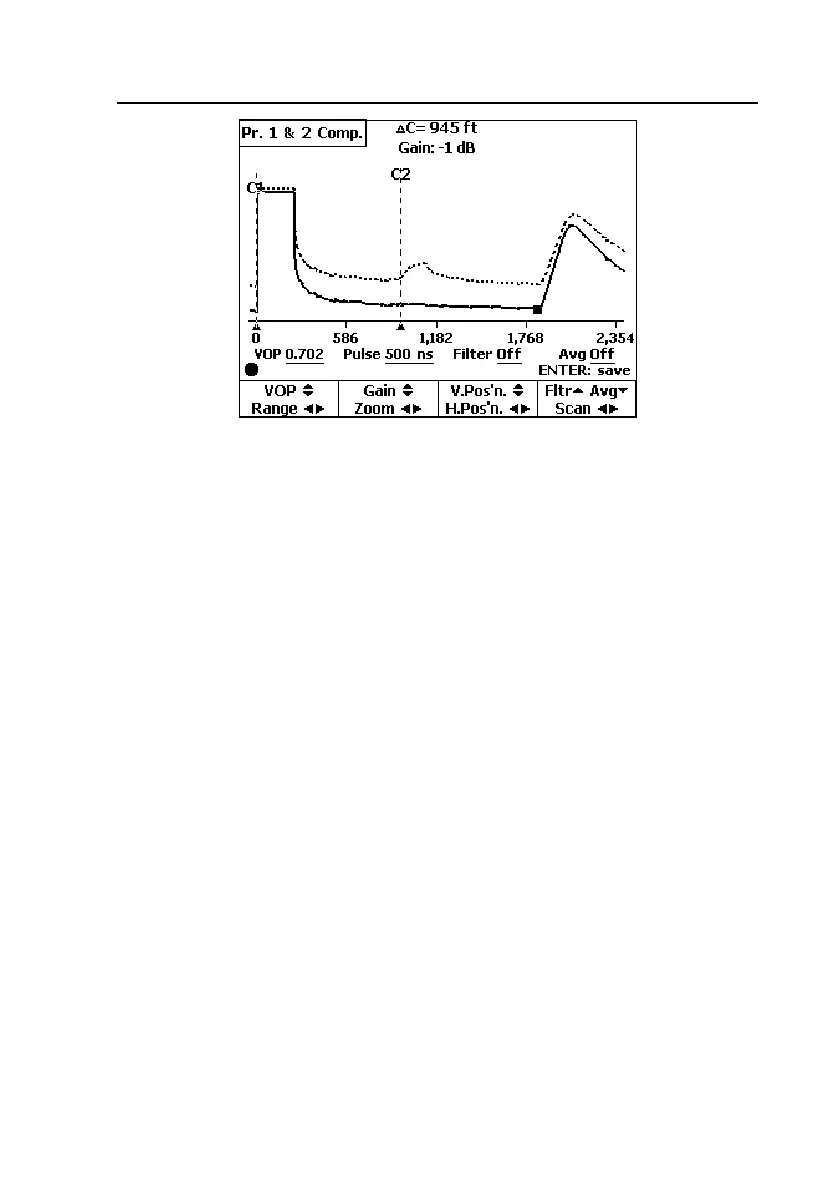
Figure 6-3. Pair 1 and 2 Compare Test Result Screen
Pair 1is always depicted as the lower trace and shown as a solid line. Pair 2 is
the upper trace, which is shown as a dotted line. In Figure 6-3, note that the
trace for Pair 2 has a minor reflection (it is marked by the reflection cursor)
that indicates a gauge change at a splice point.
Pair 1 - 2 Difference Test
This test is similar to the Pair 1 and 2 Compare test. The main difference
between the two tests is that in the Pair 1-2 Difference test, the CopperPro
internally computes the mathematical difference between the two waveforms
and displays the difference as a single trace. This presentation is especially
helpful for helping you see minor differences between two pairs—one good
and one suspect.
Pair 1 waveform data is used as the reference, and Pair 2 data is subtracted
from it to obtain the “difference” waveform. If both pairs are identical (have
exactly the same waveforms), the result is a straight line with no reflections.
The TDR softkeys operate in the same manner as those on the Pair 1 test result
screen (see “Pair 1 Test” and Table 6-3 for descriptions).