8.6 Timing Chart
115
8
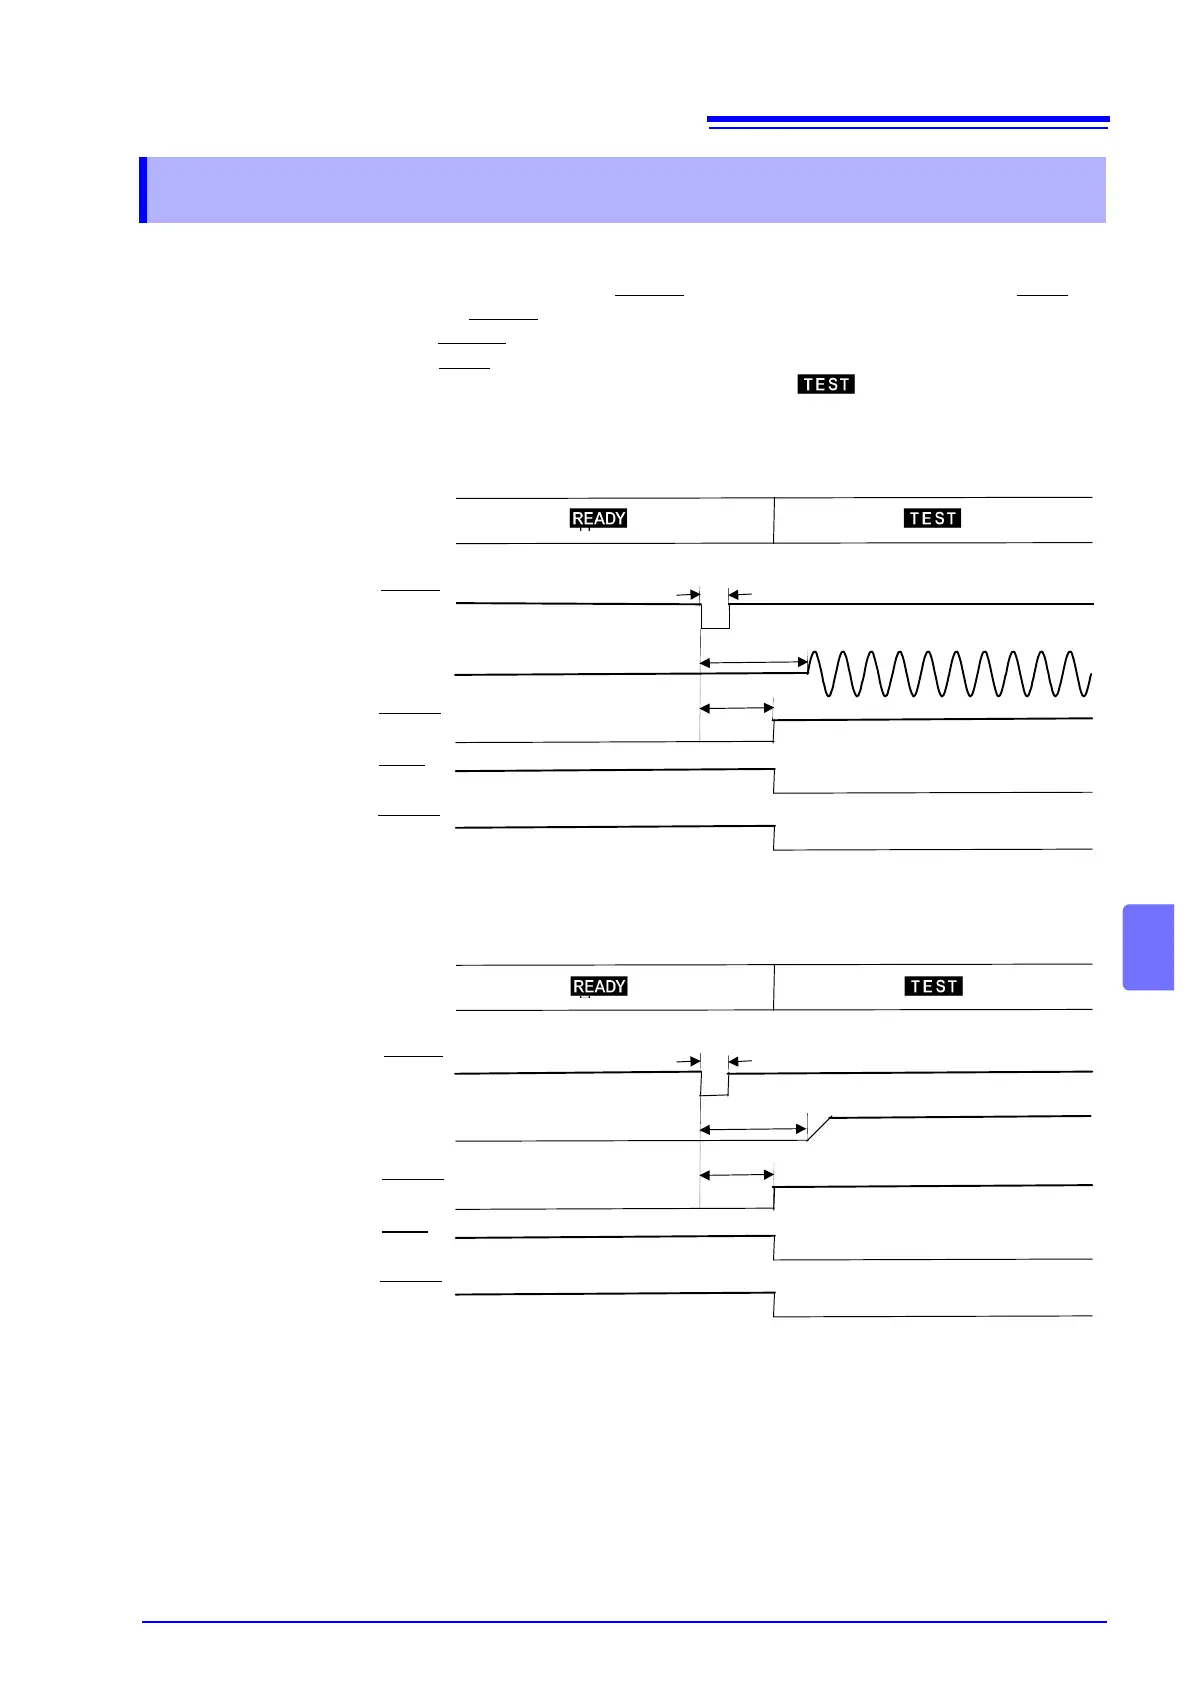
Starting the test
When a test begins, the READY signal becomes HIGH level, and the TEST sig-
nal and H.V.ON
signal become LOW level.
The H.V.ON
signal becomes LOW level with the voltage output.
The TEST
signal changes at the same time on the fluorescent indicator
changes.
During the withstand-voltage test
During the insulation-resistance test
8.6 Timing Chart
40 ms min.
110 ms max.
100 ms max.
START
Voltage
Output
READY
TEST
H.V.ON
40 ms min.
160 ms max.
100 ms max.
START
Voltage
Output
READY
TEST
H.V.ON