8. Maintenance and Inspection
8-7
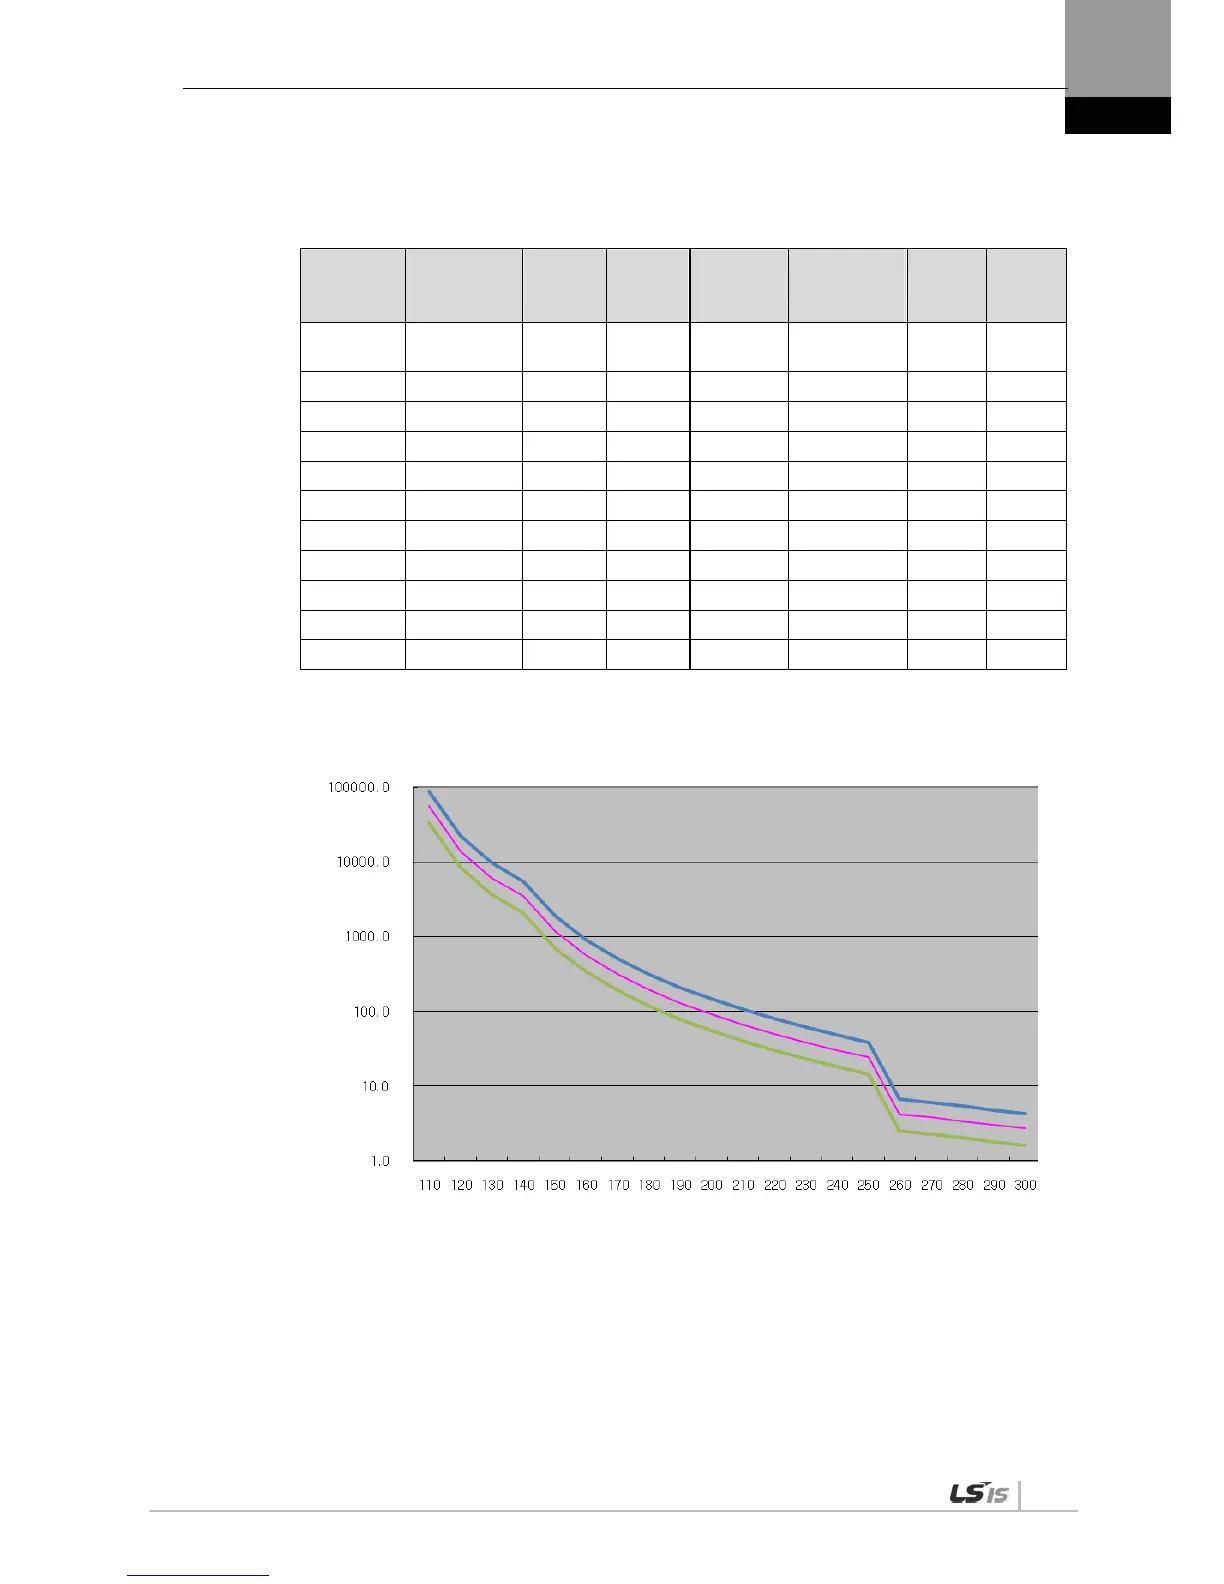
Servo Drive Overload Graphs (400W or below)
(1) Graph of Overload during Rotation
Load (%)
AL-21
Occurring
Time (sec)
MAX MIN Load (%)
AL-21
Occurring
Time (sec)
MAX MIN
100% or
below
Infinite
110 55776.0 89241.6 33465.6 210 66.8 106.9 40.08
120 13944.0 22310.4 8366.4 220 50.1 80.2 30.06
130 6197.3 9915.7 3718.38 230 38.5 61.6 23.1
140 3486.0 5577.6 2091.6 240 30.3 48.5 18.18
150 1183.0 1892.8 709.8 250 24.2 38.7 14.52
160 566.0 905.6 339.6 260 4.2 6.7 2.52
170 318.0 508.8 190.8 270 3.8 6.1 2.28
180 198.0 316.8 118.8 280 3.4 5.4 2.04
190 131.0 209.6 78.6 290 3.0 4.8 1.8
200 92.0 147.2 55.2 300 2.7 4.3 1.62
Load Curve During Rotation
Load Factor (%)
Time (sec)
 Loading...