8. Maintenance and Inspection
8-8
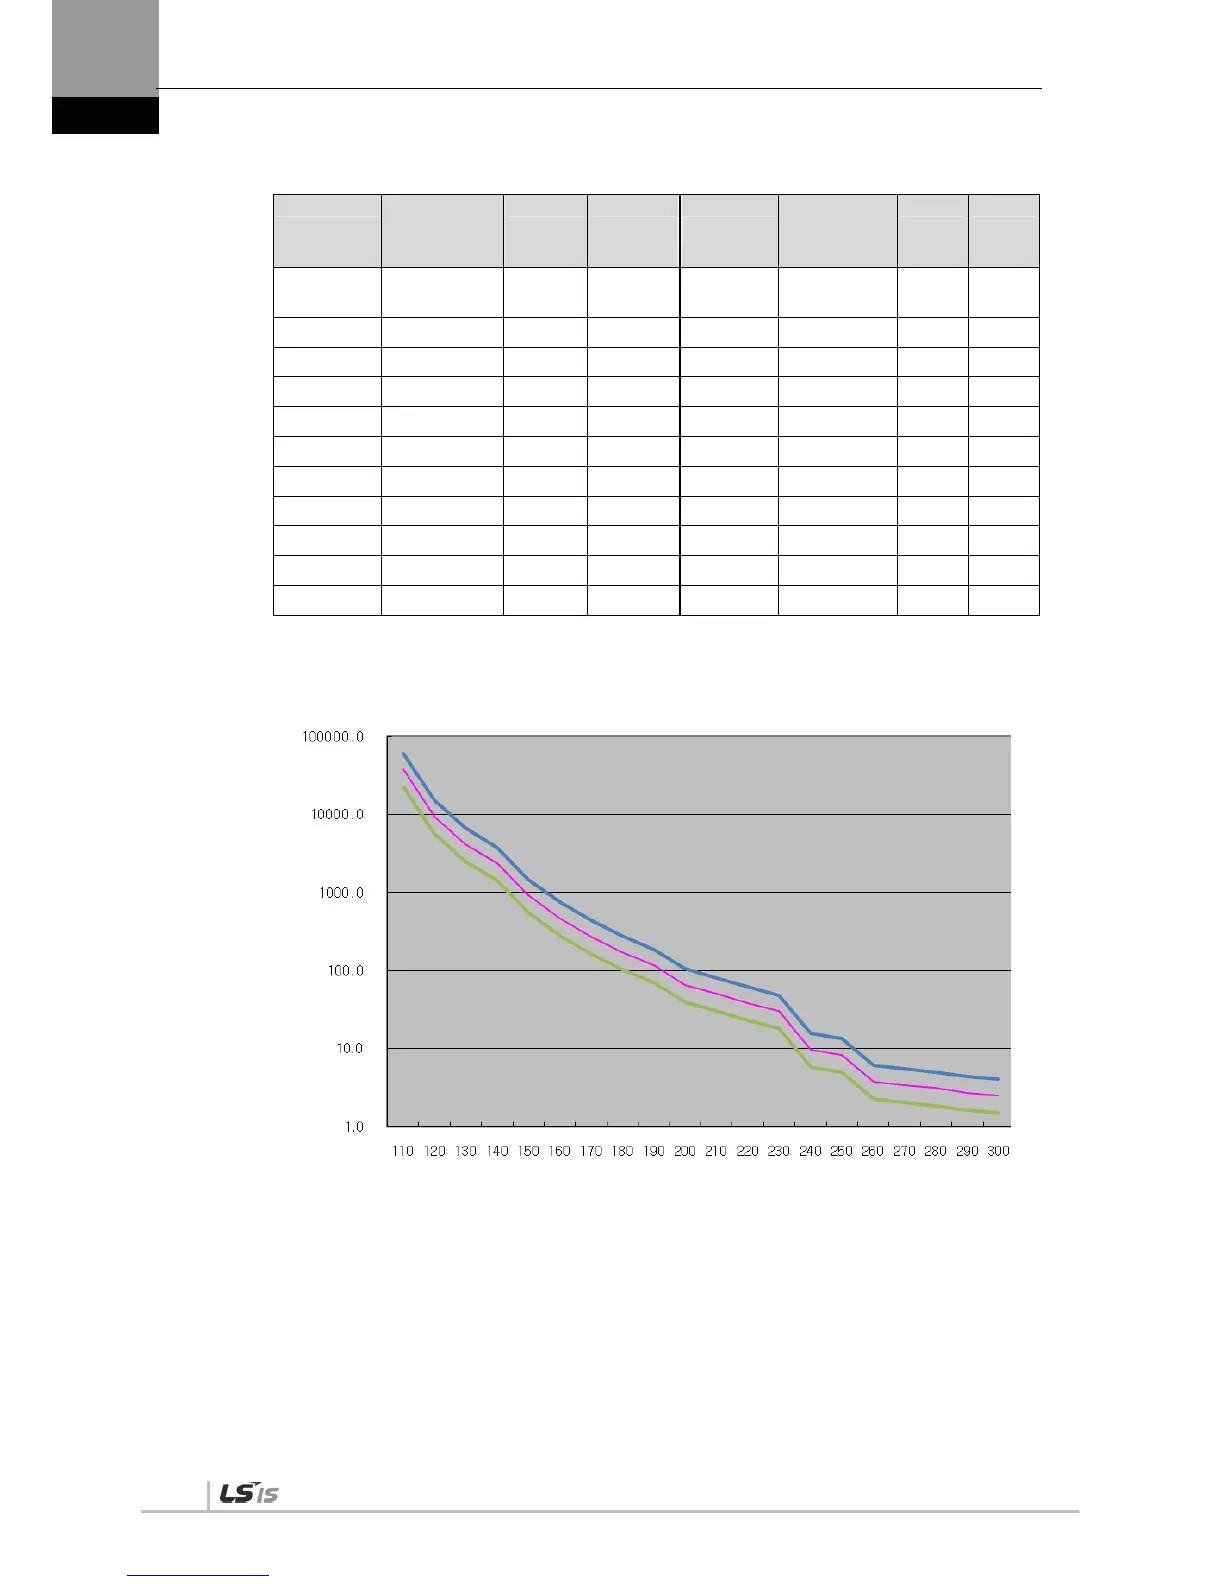
(2) Graph of Overload during Stop
Load (%)
AL-21
Occurring
Time (sec)
MAX MIN Load (%)
AL-21
Occurring
Time (sec)
MAX MIN
100% or
below
Infinite
110 37937.7 60700.3 22762.62 210 50.1 80.2 30.06
120 9483.9 15174.2 5690.34 220 38.5 61.6 23.1
130 4215.1 6744.2 2529.06 230 30.3 48.5 18.18
140 2371.0 3793.6 1422.6 240 9.7 15.5 5.82
150 926.0 1481.6 555.6 250 8.3 13.3 4.98
160 470.0 752.0 282 260 3.8 6.1 2.28
170 273.0 436.8 163.8 270 3.4 5.4 2.04
180 173.0 276.8 103.8 280 3.1 5.0 1.86
190 117.0 187.2 70.2 290 2.7 4.3 1.62
200 66.0 105.6 39.6 300 2.5 4.0 1.5
Load Curve During Stop
Load Factor (%)
Time (sec)
 Loading...