8. Maintenance and Inspection
8-9
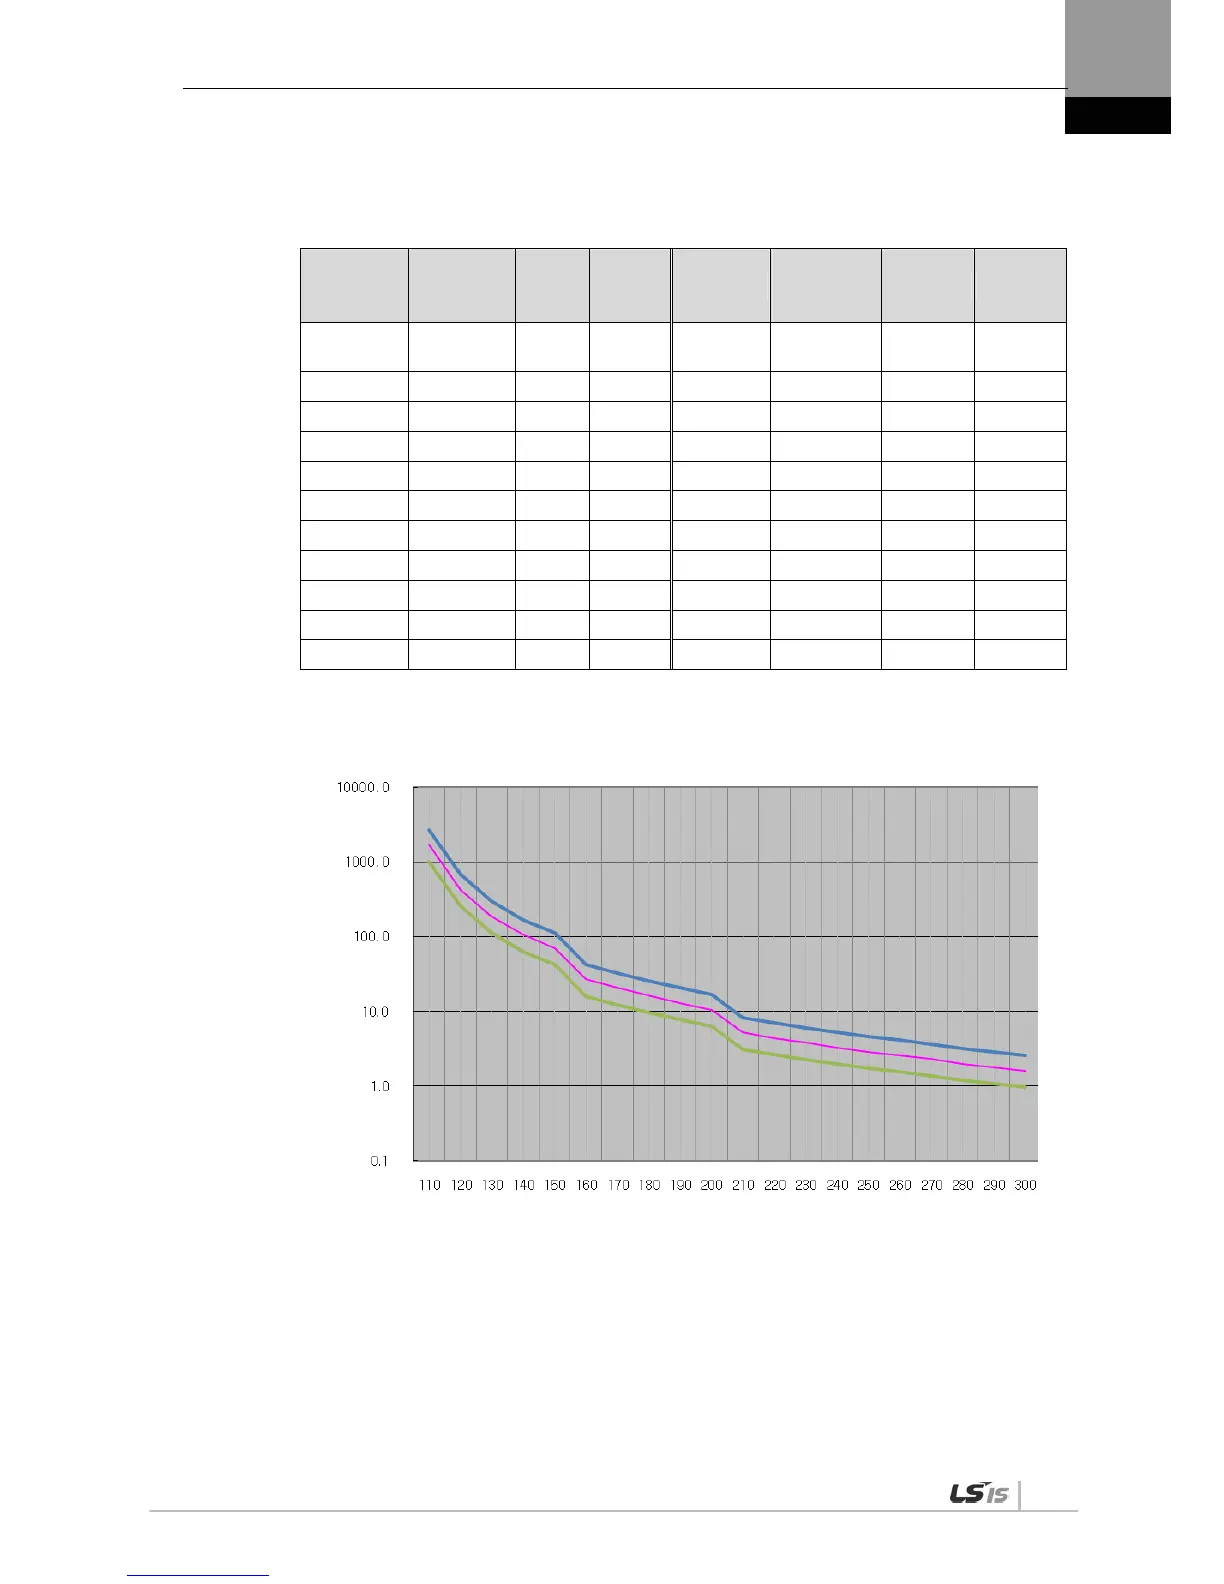
Servo Drive Overload Graphs (SA type of 100 W or below)
(1) Graph of Overload during Rotation
Load (%)
AL-21
Occurring
Time (sec)
MAX MIN Load (%)
AL-21
Occurring
Time (sec)
MAX MIN
100% or
below
Infinite
110 1696.0 2713.6 1017.6 210 5.2 8.3 3.12
120 424.0 678.4 254.4 220 4.4 7.0 2.64
130 188.4 301.5 113.064 230 3.8 6.1 2.28
140 106.0 169.6 63.6 240 3.3 5.3 1.98
150 70.4 112.6 42.24 250 2.9 4.6 1.74
160 26.8 42.9 16.08 260 2.6 4.2 1.56
170 20.6 33.0 12.36 270 2.3 3.7 1.38
180 16.2 25.9 9.72 280 2.0 3.2 1.2
190 13.0 20.8 7.8 290 1.8 2.9 1.08
200 10.5 16.8 6.3 300 1.6 2.6 0.96
Load Curve during Rotation 100 W or Lower SA Type
Load Factor (%)
Time (sec)
 Loading...