8. Maintenance and Inspection
8-10
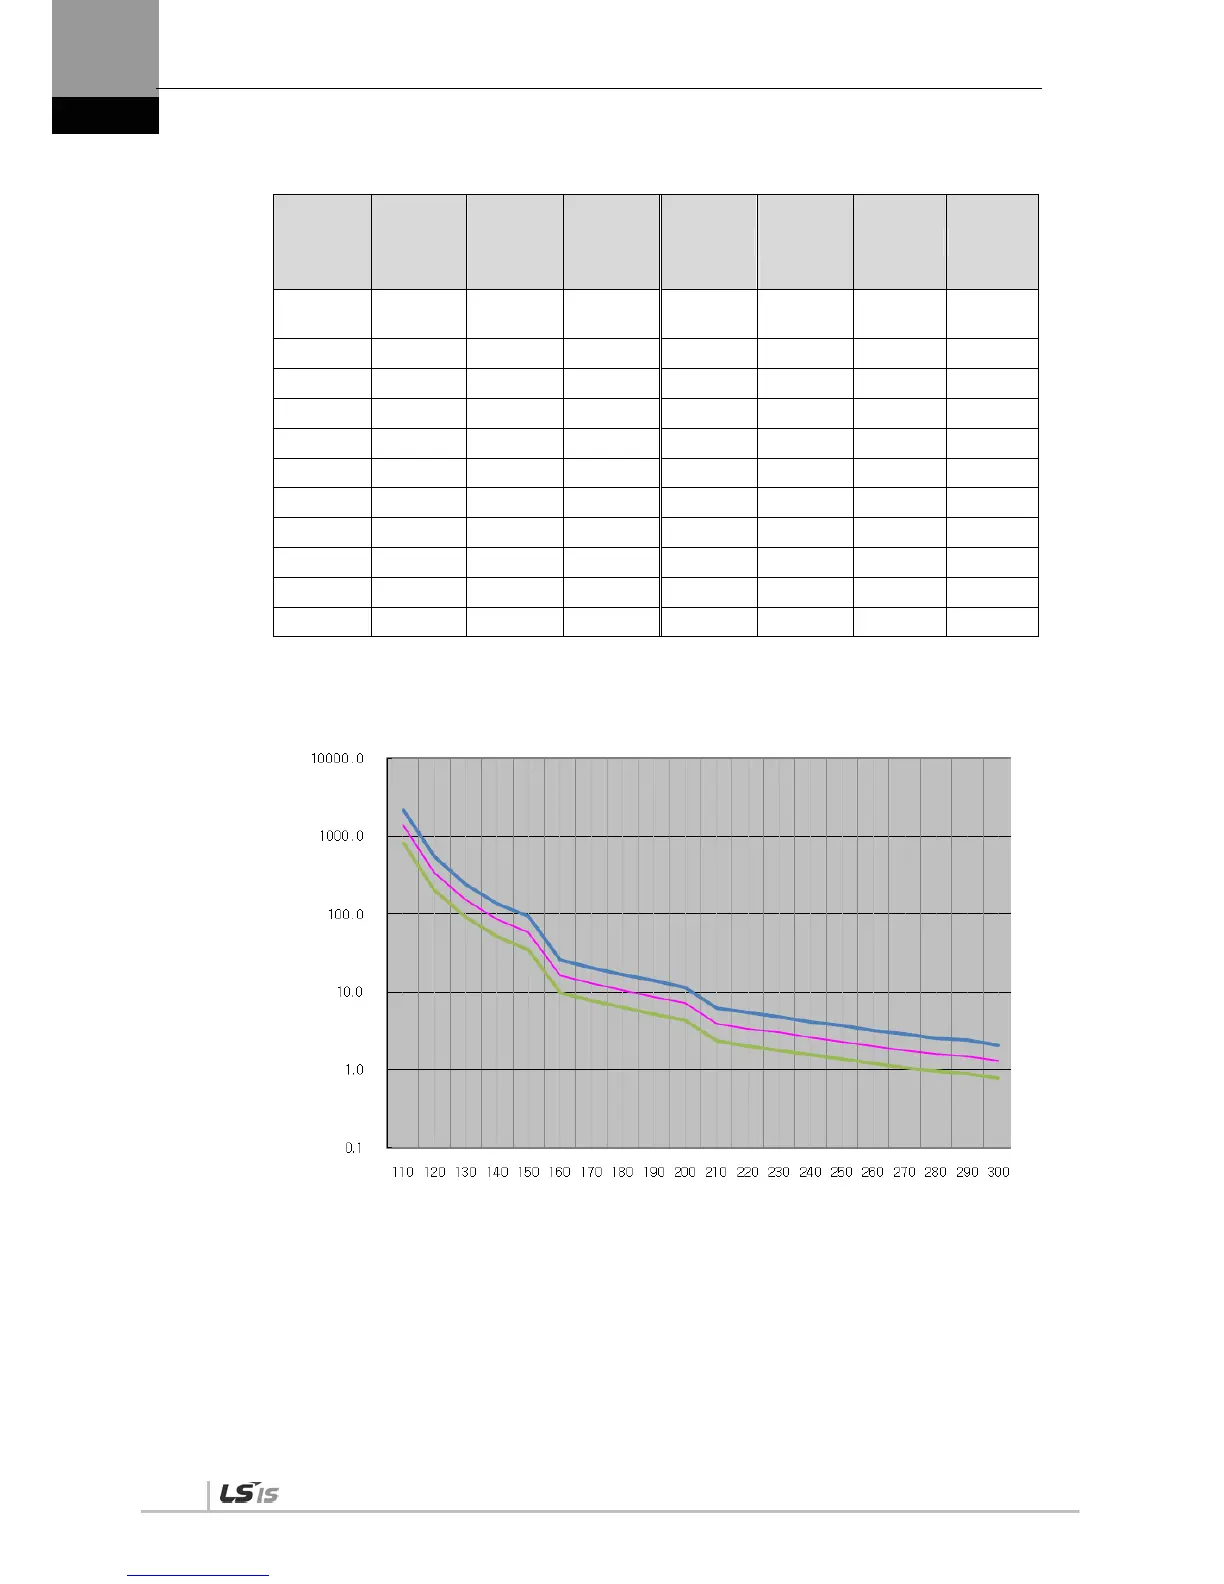
(2) Graph of Overload during Stop
Load (%)
AL-21
Occurrin
g Time
(sec)
MAX MIN Load (%)
AL-21
Occurring
Time
(sec)
MAX MIN
100% or
below
Infinite
110 1372.8 2196.5 823.68 210 3.9 6.2 2.34
120 343.2 549.1 205.92 220 3.4 5.4 2.04
130 152.5 244.0 91.518 230 3.0 4.8 1.8
140 85.8 137.3 51.48 240 2.6 4.2 1.56
150 58.6 93.8 35.16 250 2.3 3.7 1.38
160 16.2 25.9 9.72 260 2.0 3.2 1.2
170 13.0 20.8 7.8 270 1.8 2.9 1.08
180 10.5 16.8 6.3 280 1.6 2.6 0.96
190 8.7 13.9 5.22 290 1.5 2.4 0.9
200 7.2 11.5 4.32 300 1.3 2.1 0.78
Load Curve during Stop 100 W or Lower SA Type
Load Factor (%)
Time (sec)
 Loading...