8. Maintenance and Inspection
8-11
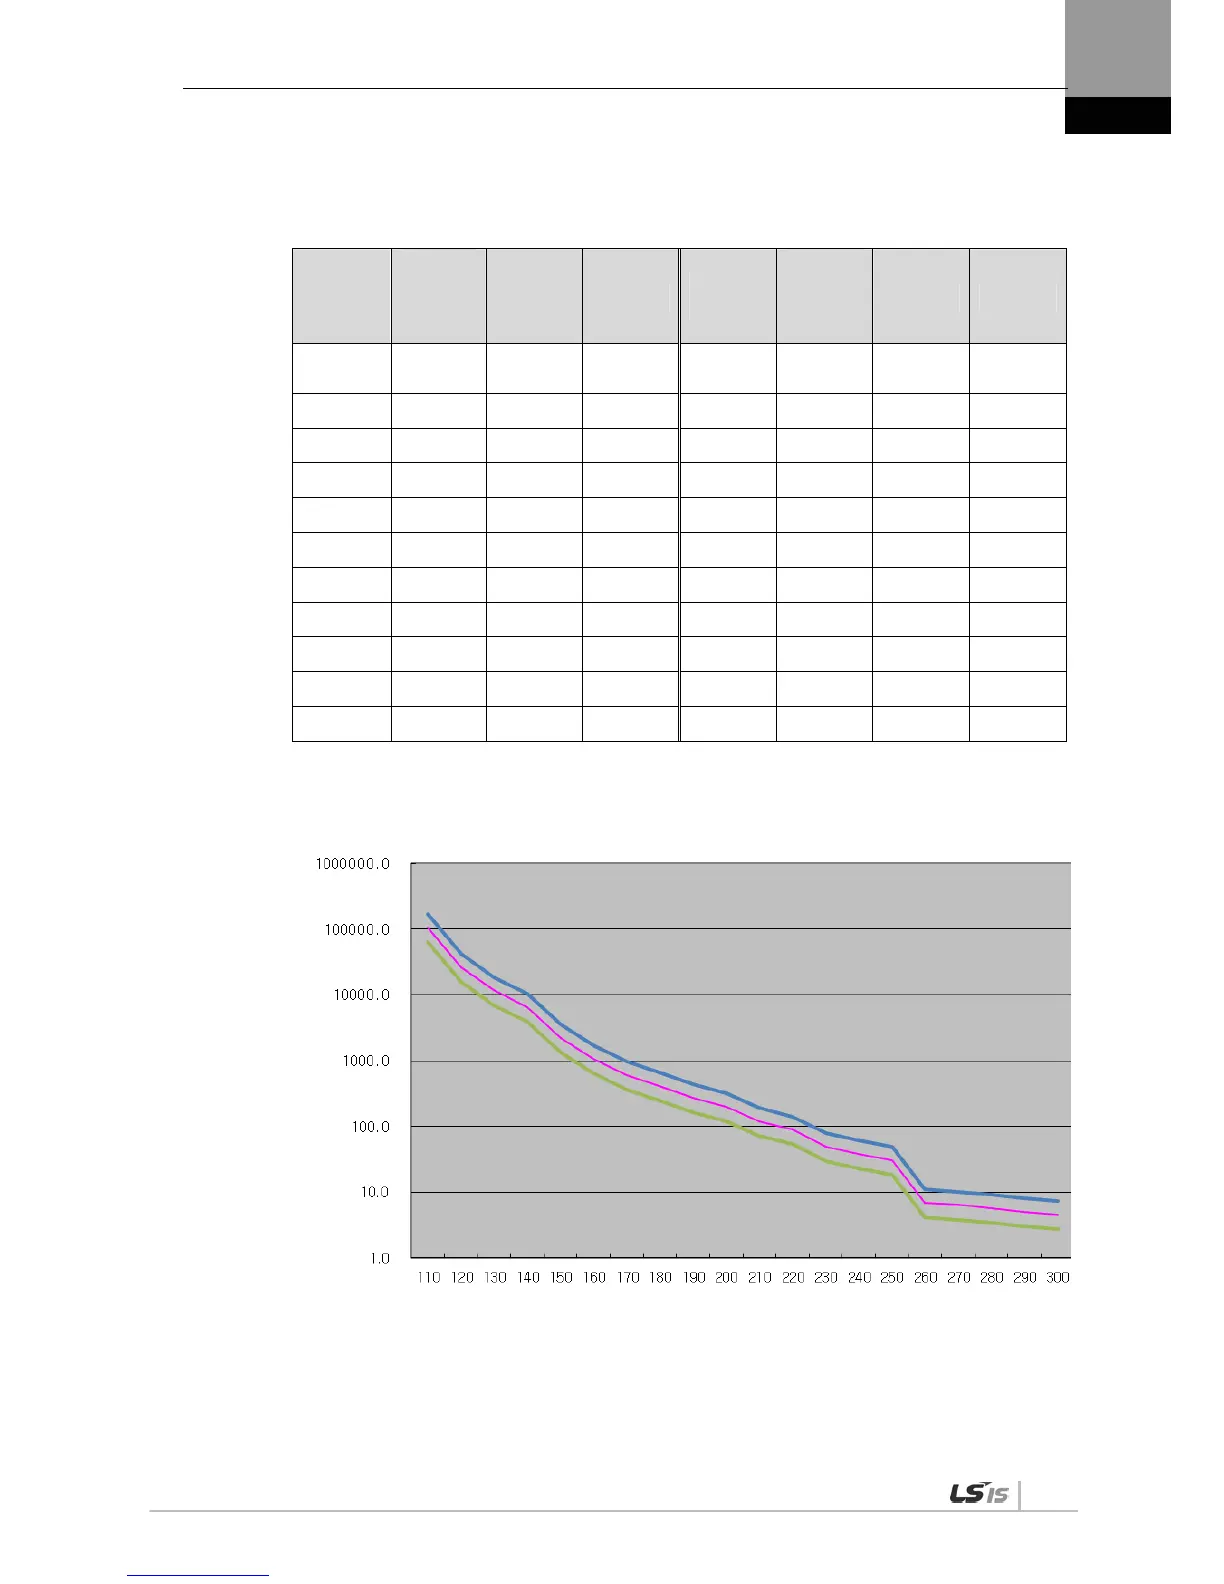
Servo Drive Overload Graphs (750W, 1.0KW)
(1) Graph of Overload during Rotation
Load
(%)
AL-21
Occurri
ng Time
(sec)
MAX MIN
Load
(%)
AL-21
Occurri
ng Time
(sec)
MAX MIN
100% or
below
Infinite
110 105800 169280.0 63480 210 119.0 190.4 71.4
120 26450 42320.0 15870 220 89.2 142.7 53.52
130 11755 18808.0 7053 230 49.3 78.9 29.58
140 6612.5 10580.0 3967.5 240 38.8 62.1 23.28
150 2244.0 3590.4 1346.4 250 31.0 49.6 18.6
160 1073.6 1717.8 644.16 260 7.0 11.2 4.2
170 603.2 965.1 361.92 270 6.4 10.2 3.84
180 413.6 661.8 248.16 280 5.7 9.1 3.42
190 273.6 437.8 164.16 290 5.0 8.0 3
200 201.0 321.6 120.6 300 4.6 7.4 2.76
Load Curve during Rotation
Load Factor (%)
Time (sec)
 Loading...