Field or Button Description
Regression report. Select to run a Regression report.
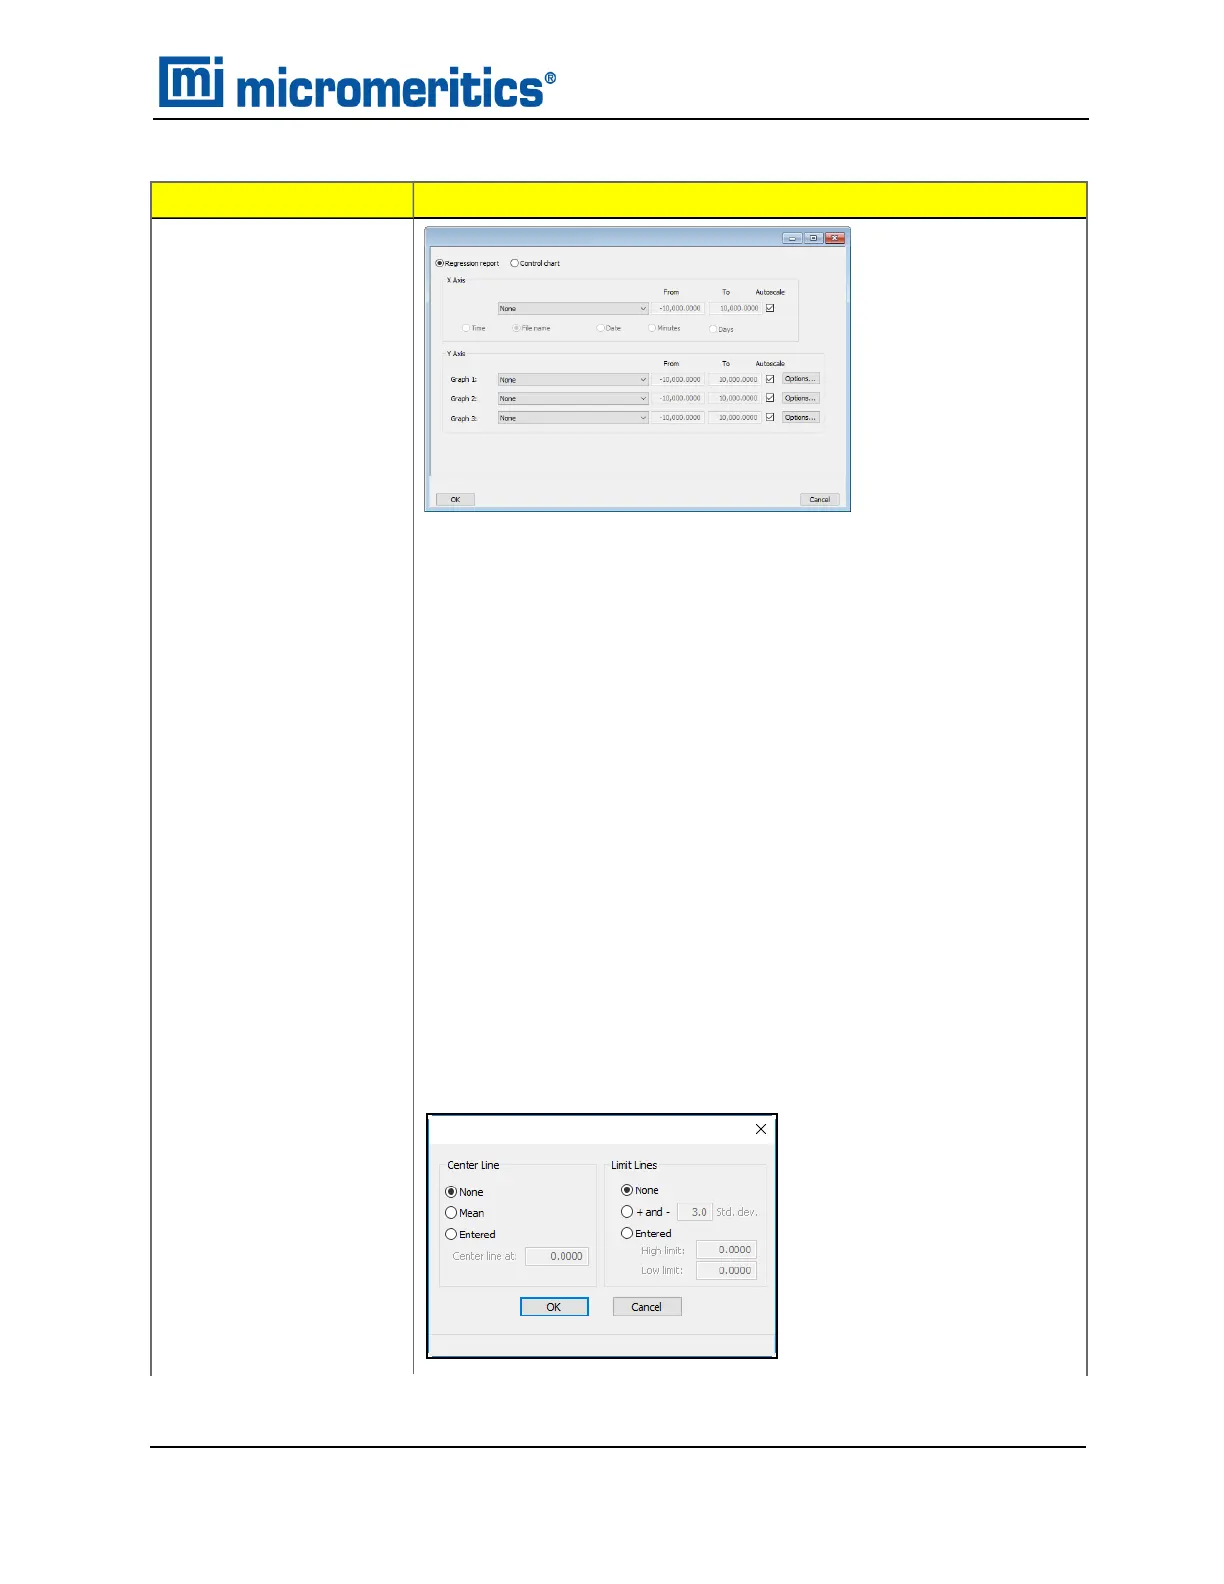
Control chart. Select to run a Control chart report.
X-Axis.
n Autoscale. Allows the y-axis to be scaled automatically. To specify
a range, deselect this option and enter a range in the From and To
fields.
Select the order in which x-axis statistics are placed. Sort by:
n Time. Time the files were analyzed.
n File name. Alphanumeric order.
n Date.Date the files were analyzed.
n Minutes. Minutes elapsed from the first file placed on the list, which
is the earliest-analyzed file.
n Days.Number of days elapsed from the first file placed on the list,
which is the earliest analyzed file.
Y-Axis. Click Options to define the control chart graph.
SPCReport (continued)
SPC Report
AccuPyc II 1345 Operator Manual
134-42851-01 (Rev A) — Jan 2021
7 - 3
 Loading...


