1 - 5
PROCESS
[9] Magnification Processing
In an analog machine, the
vertical
magnification is changed by
changing the scanning speed of the exposure unit, and
horizontal
magnification by changing the position of the lens. In this
machine, the
vertical
magnification is changed by changing
the scanning speed of the exposure unit, and the
horziontal
magnification by means of electrical image processing.
The read unit of the CCD (63.5 µm) and the write unit of the
laser (63.5 µm) are equal to each other, and remain unchanged
when the copy image is enlarged or reduced in the
horizontal
direction. As a result, write data that corresponds exactly to the
write position when the image is enlarged or reduced in the
horizontal
direction sometimes fails to exist.
1.
Horizontal
magnification change processing
during enlargement
As shown in the example of Fig.10, if the pixel data obtained
when the original is read by the CCD is D
1 to D5, the
positions of the read data when the image is enlarged are
E
1 to E5.. However, the following problems will occur if the
write data consists of this read data alone.
(a) There will be a gap between one data and the next,
resulting in gaps in the image.
(b) The data position and write position will not coincide
exactly.
Consequently, if read data that corresponds exactly to the
write position fails to exist, as indicated by the dotted lines
of Fig.10, the write density is determined as shown below.
2.
Horziontal
magnification change processing
during reduction
As shown in the example of Fig.11, if the pixel data obtained
when the original is read by the CCD is D
1 to D5, the positions
of the read data when the image is reduced overlap each other
as indicated by R
1to R5, hence the write positions fail to
coincide with the read positions.Therefore, the write density is
determined as shown below.
Fig.10
Original read position
Write position
E3
D1 D2 D3 D4 D5
W1 W2 W3 W4 W5 W6 W7 W8
E1 E2 E4 E5
Data position when
image is enlarged
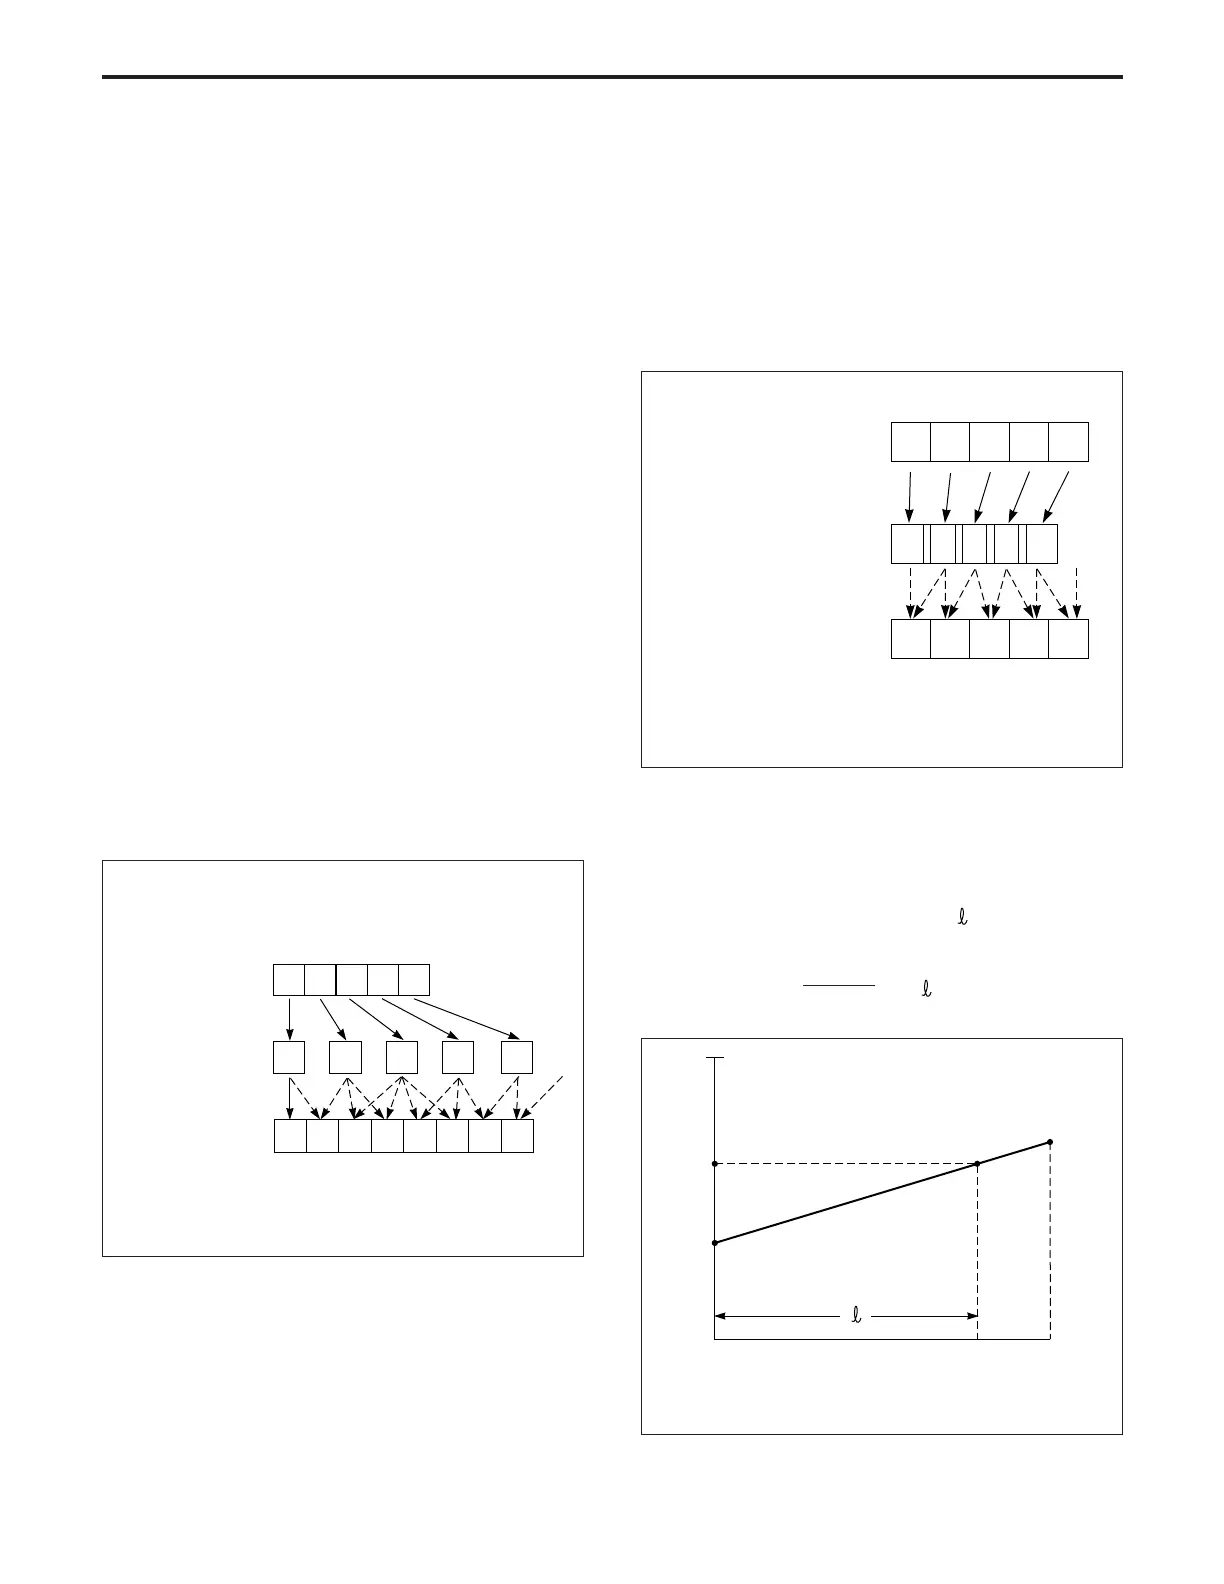
3. Density correction
Figure 11 is a graph the vertical axis of which represents
density (256 steps) and the horizontal axis of which represents
position: Here, the distance between E
2 and E1 of Fig.10 is set
out on the horizontal axis and divided into 16 steps. If the
position with respect to write data W
2 is “ ”, the density S can
be obtained using the following equation.
S = E1 + ( ) x
Fig.11
Original read position
Data position when the
image is reduced
Write position
R3
W1 W2 W3 W4 W5
D1 D2 D3 D4 D5
R1 R2 R4 R5
E 2 – E1
16
0
0
15
E1
S
W2
E2
255
Position
Fig.12
Density
PROCESS-1