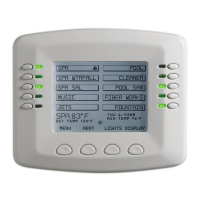
Summary View
Usage Screen: Displays up to six months of system historical usage data. Tap
the - Minus or + Plus button to select the desired Time Period to view the items.
The Time Period selection range is one day, two days, one week, one month, three
months or six months.
Usage items: You can select any of the following six items to display on the
Summary View screen. The items are: Any of the following six items can be
displayed on the Summary View screen: Air Temp, Pool Water Temp, Spa Water
Temp, Solar Temp, Gas Heater, Heat Pump, UltraTemp (Hybrid), Pool Pump, Spa
Pump, Dual Speed Pump, IntelliFlo (VS, VSF, VF), pH Data, ORP Data, pH Feed
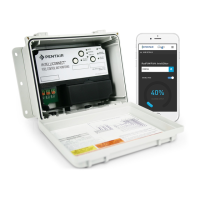
Time, ORP Feed Time. Note: Up to 6 months of historical usage date can be stored
on intellicenter.com.
Edit Pencil icon: Tap the Edit Pencil button to access the Edit Summary View
screen (see next page). From the Edit Summary View screen you can arrange the
usage items listing order (1-6) and also select other system items to display. See
the complete Usage Item list as shown above (Usage Items).
Summary View: Minus and Plus Buttons: Tap the - Minus or + Plus button to select
the desired Time Period to view the items.
This Period, Last Period: This Period displays the current system usage date
compared to the Last Period date selected. The current time period is displayed on
the bottom of the screen.
Graph Icon: Tap this icon to display a
graph view of the Summary View items
(1-6).
Graph Icon: Tap this icon to display a
visual comparison of a preset list of items
(Heater vs Pump Usage). See page
28.
Graph Icon: Tap this icon to display a
graph view comparison of a preset list of
items. See page
28.
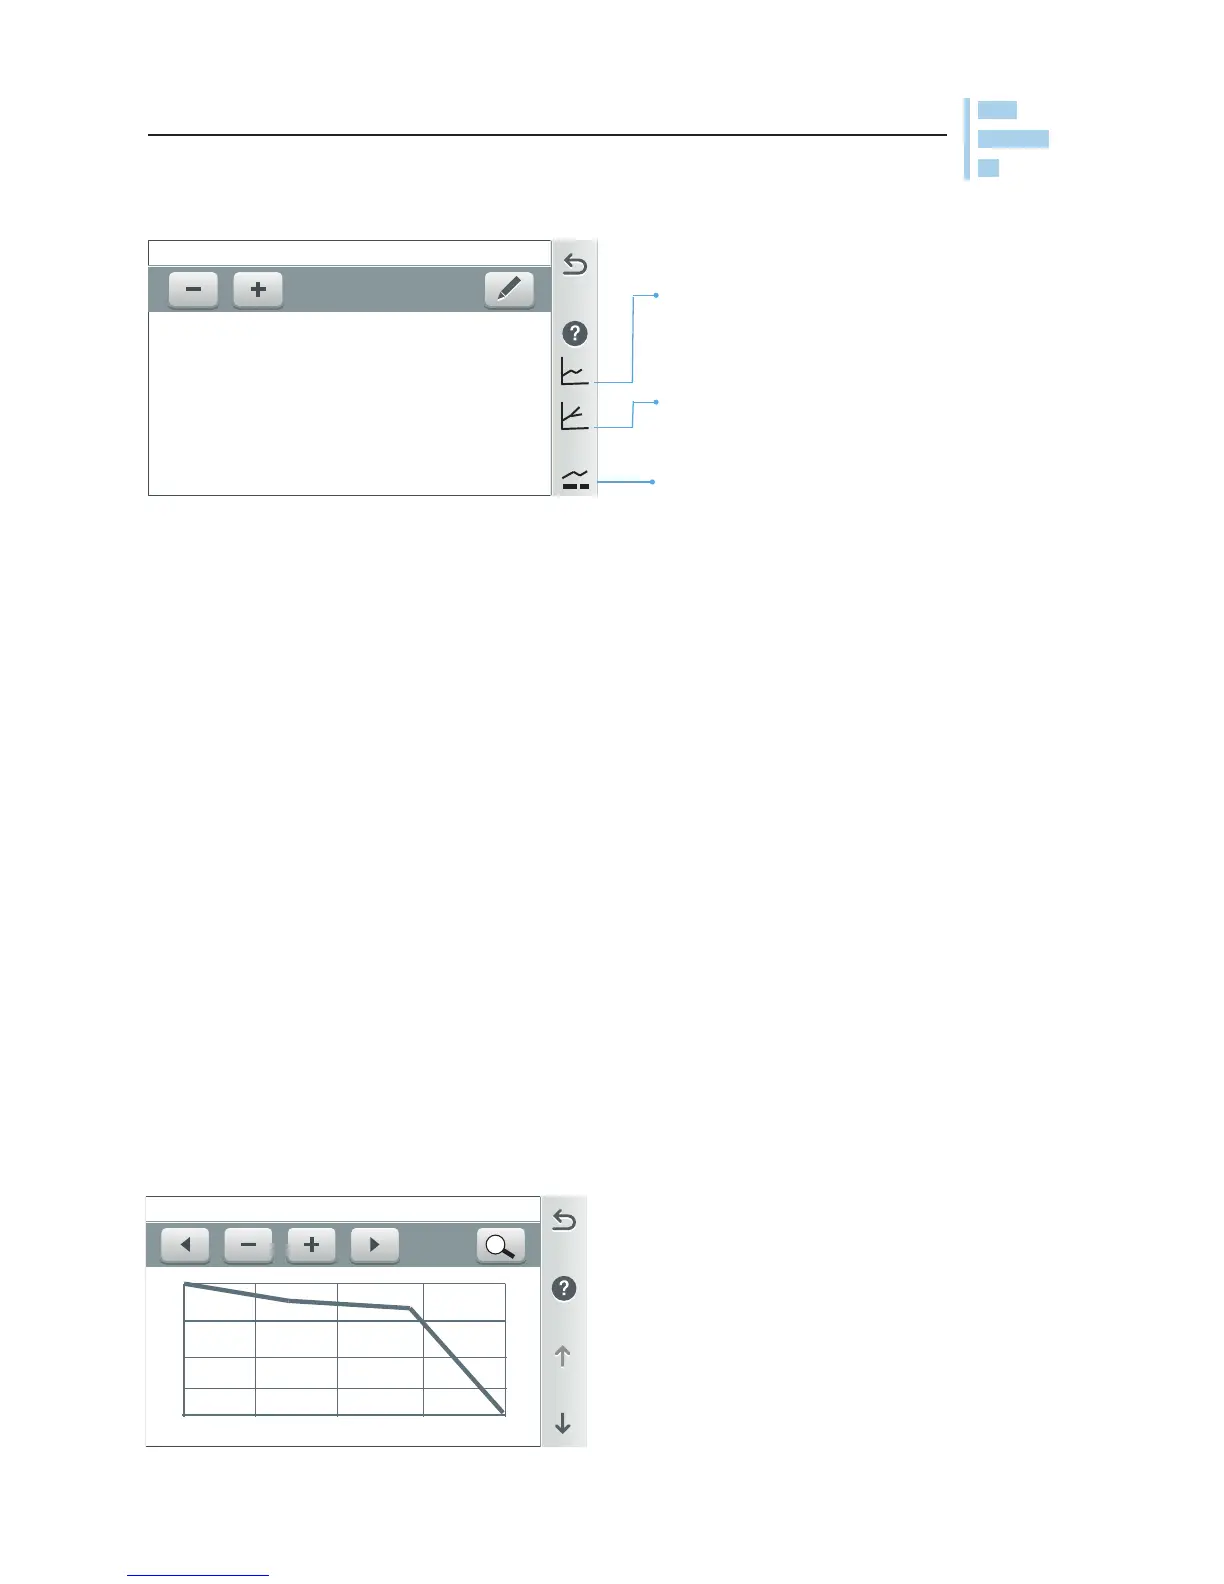
Summary View
Tap the first Graph icon on the
Summary View screen to access a
graph view of the displayed Usage
Items (1-6).
Note: See Settings > Advanced System
Configuration > Import/Export to
export status logs to a USB device,
page 89.
Graph View Icon (first graph icon right side of the screen)

 Loading...