IntelliCenter Control System User’s Guide
28 |
Air Temperature
0
7 AM 10 AM 12 PM
3 PM
Period:
2 Days
Tuesday Jan 24 to Wed Jan 25, 2017
12
24
36
48
Graph View Icon (second graph icon) Compare Preset Item List
Pool vs Spa Water Temp
Air vs Pool Water Temp
Air vs Spa Water Temp
Air vs Solar Water Temp
Pool Water Temp. vs Gas Heater
Spa Water Temp. vs Gas Heater
pH vs ORP Feed time
pH vs ORP Feed time
pH vs ORP Data
pH vs ORP Feed time
Pool Water Temp vs Solar Heater
Spa Water Temp vs Solar Heater
Pool Water Temp vs HeatPump Heater
Spa Water Temp vs HeatPump Heater
Pool Water Temp vs Ultra Heater
Spa Water Temp vs Ultra Heater
Pool Water Temp vs Hybrid Heater
Spa Water Temp vs Hybrid Heater
pH vs ORP Data
pH vs ORP Feed Time
pH vs Feed Time / ORP vs Feed Time
Usage Graph Comparison Items (Heater vs Pump)
Left and Right Buttons: Use these buttons
to scroll through a selected item details
from
Magnifying Glass Button: Tap the magnifying glass button the to display the
highest usage data for the selected item. Tap the button again to display the lowest
usage data.
Temperature (�F) vs Usage (On/Off)
60
40
20
0
Pool Temp
Spa Temp
Air Temp
Pool %
Spa %
7 AM 10 AM 12 PM
3 PM
Period:
2 Days
Heater Gas %
Heater Solar %
Tuesday Jan 24 to Thurs Jan 26, 2017
Usage (Graph) Comparison Items
Magnifying Glass Button: Tap the magnifying glass button the to display the
highest usage data for the selected item. Tap the button again to display the lowest
usage data. Up and Down Arrows: Use the Up or Down arrow to scroll through
the preset usage items. The preset usage items are: Pool Water Temp, Spa Water
Temp, Air Temp, Pool %, Spa %, Gas Heater %, Solar Heat %. After scrolling to the
last item, continue to tap the Up/Down button to return to the Summary View. Also,
tap the Down arrow (right side of graph screen) to display system configured AUX
circuits usage data.
Summary View
Air Temp
Pool Water Temp
Spa Water Temp
Gas Heater Usage
Pool Pump Usage
Spa Pump Usage
H:74°/L:57°
Last Period
36 %
25.7 %
30.4 %
Time Period: 30 days
H:78°/L:59°
This Period
25 %
37.5 %
32.5 %
Edit
H:80°/L:60°
H:75°/L:58°
H:102°/L:85°
H:104°/L:90°
Items
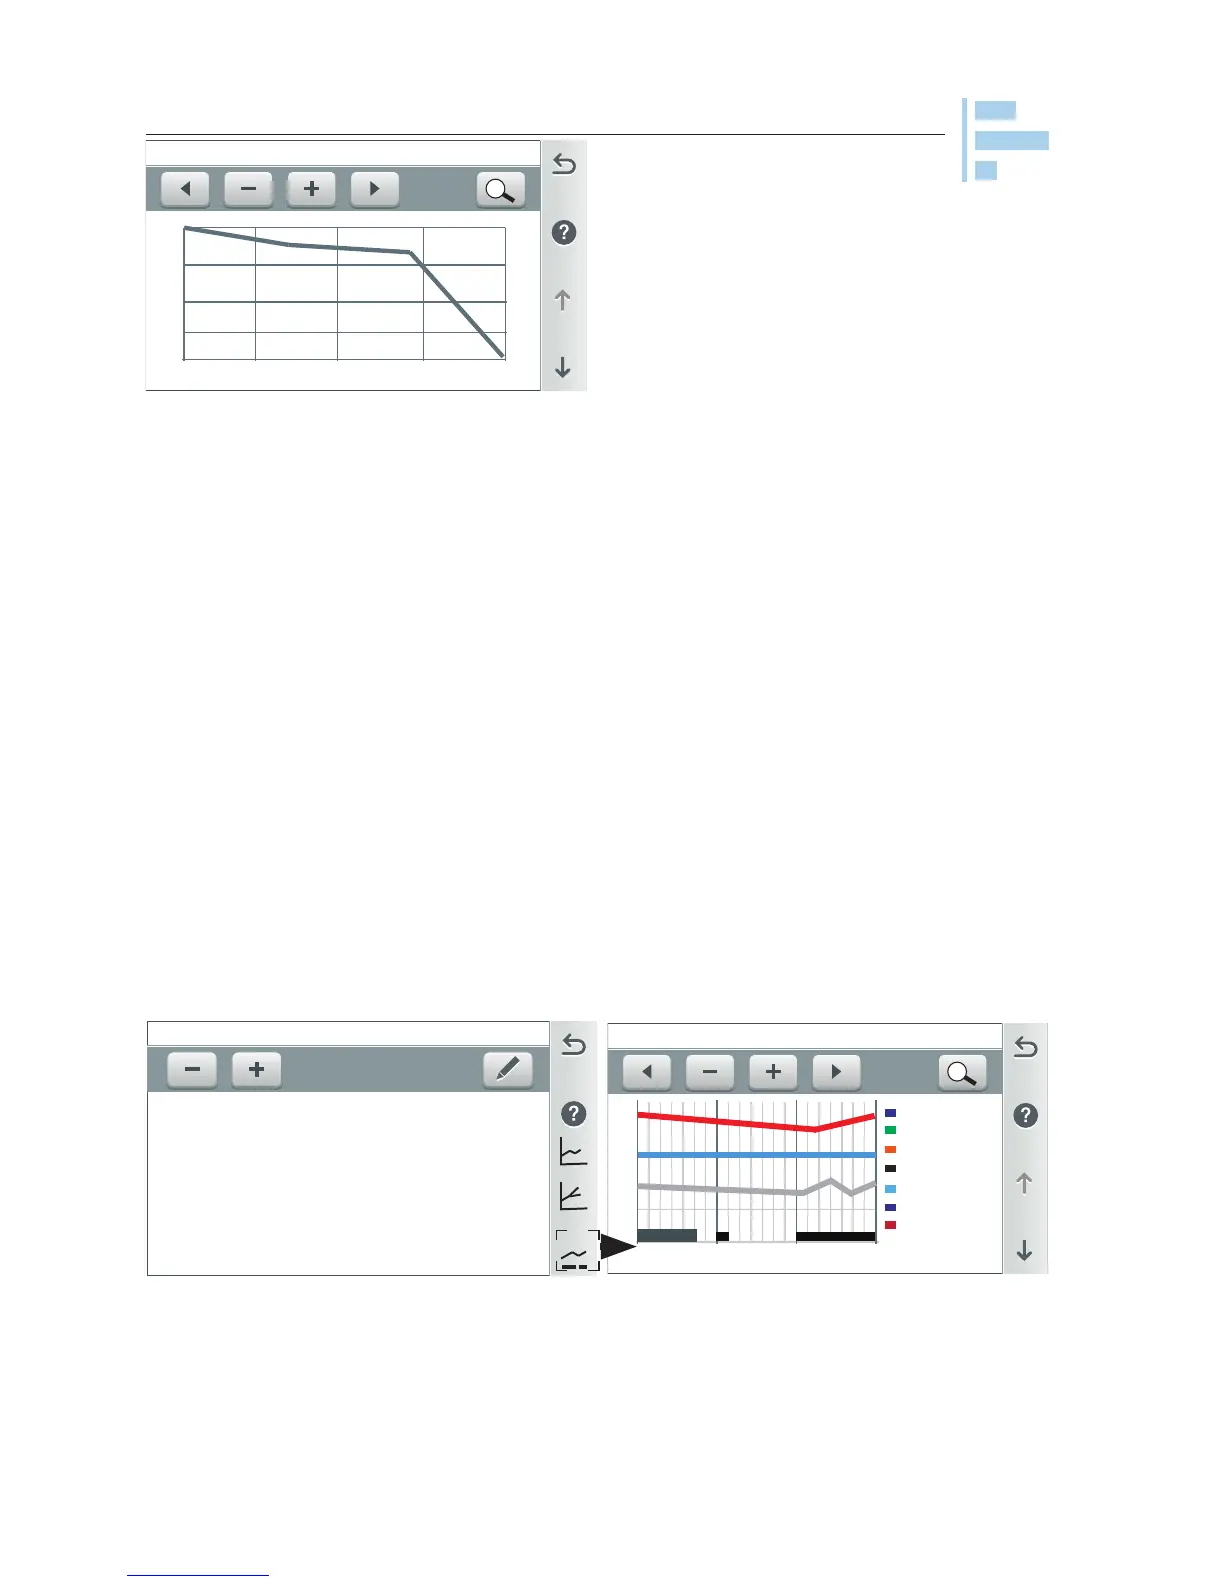
This Graph displays a detailed usage view of the preset items for a selected time
period (up to six months). To access the compare graph, tap the lower Graph icon on
the Summary View screen.
Tap the first Graph icon on the
Summary View screen to view
the preset item comparison list. See list
below. Tap the Down arrow button to
scroll through the graph items.
- Minus or + Plus Button: Tap the to
select the desired Time Period to view
the items. The Time Period selection
range is one day, two days, one week,
one month, three months or six
months.

 Loading...