Measurement Item Setting Range
Capacitance
(-120% of the current range) to (120% of
the current range)
Frequency -120 kHz to 120 kHz
Period -60 ms to 60 ms
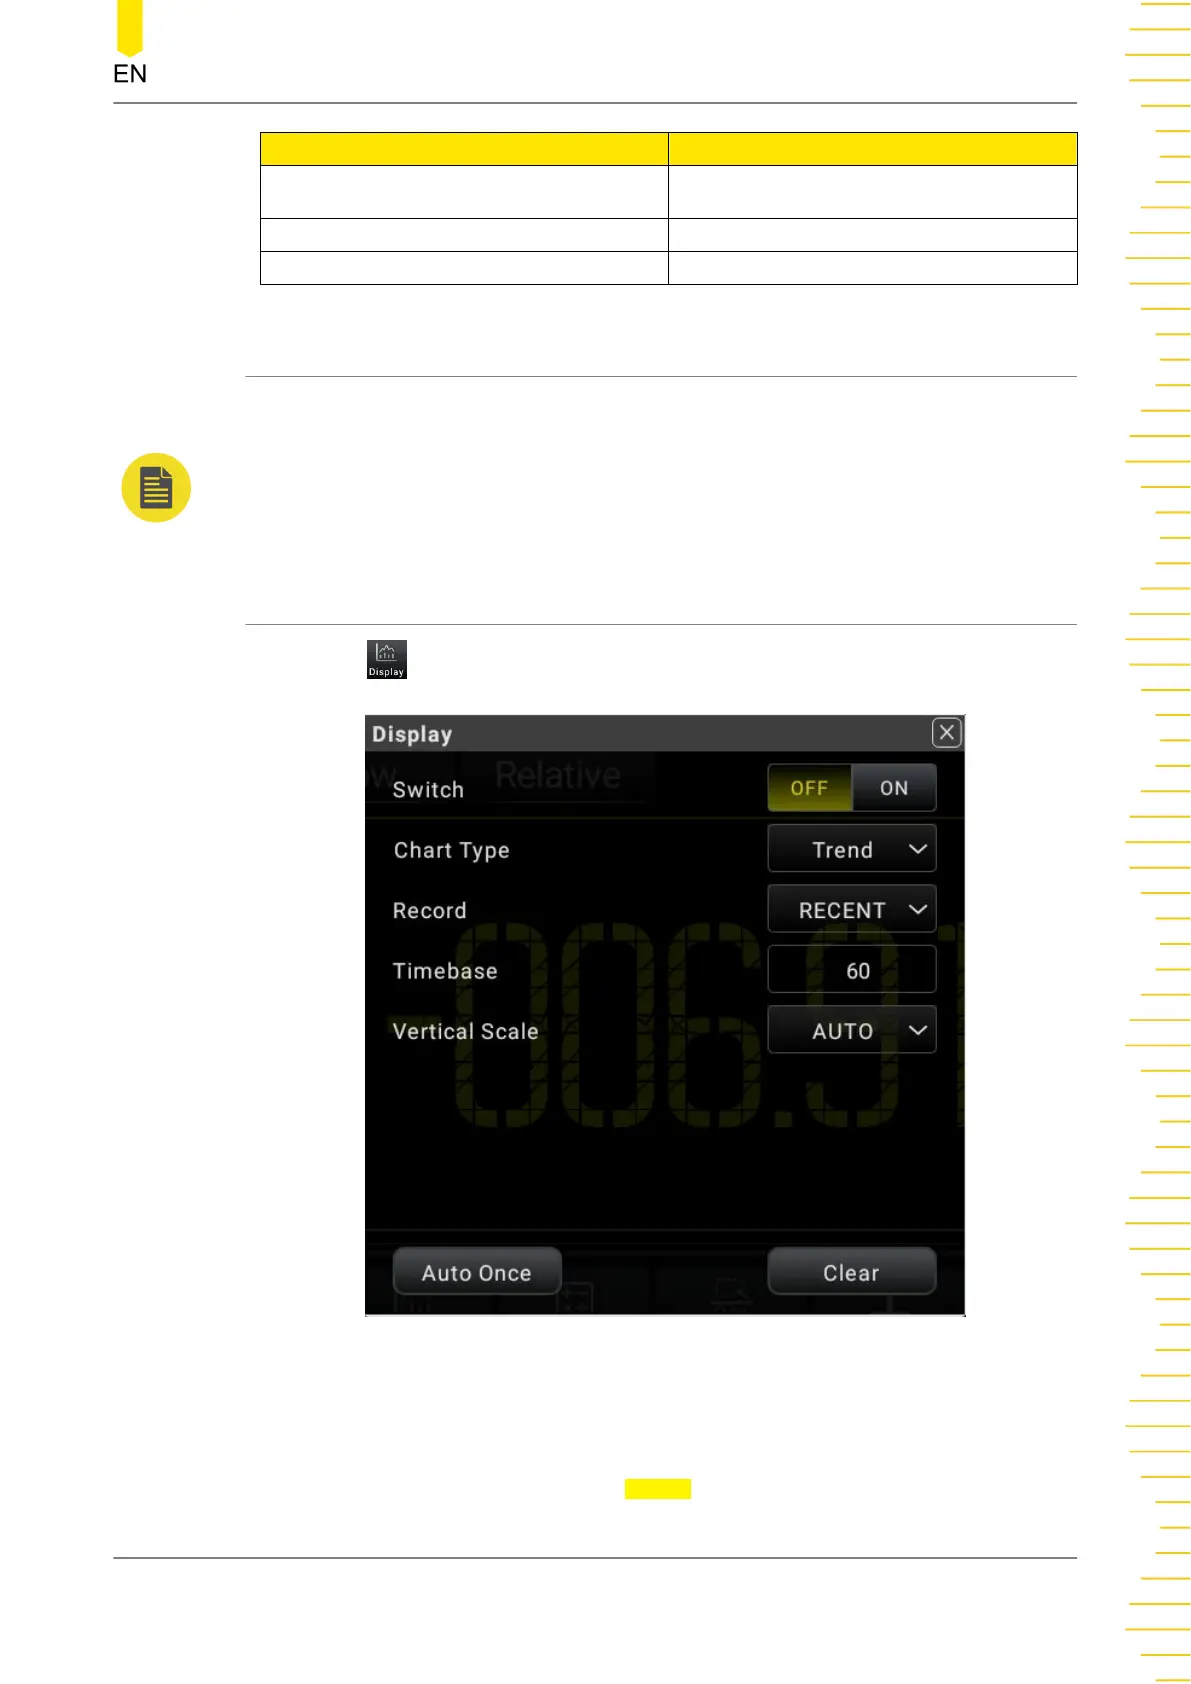
5.7 Graph Display
The measurement results can be displayed in Trend, Histogram, and Bar Chart.
NOTE
The graph display is disabled in Continuity and Diode tests.
5.7.1 Trend Graph
Click or tap to enter the graph display interface.
Figure 5.50 Graph Display
1. Enable the graph
Click or tap the ON/OFF tab for the Switch menu to enable or disable the graph
display.
Front Panel Operation
Copyright ©RIGOL TECHNOLOGIES CO., LTD. All rights reserved. DM858 Series User Guide
81