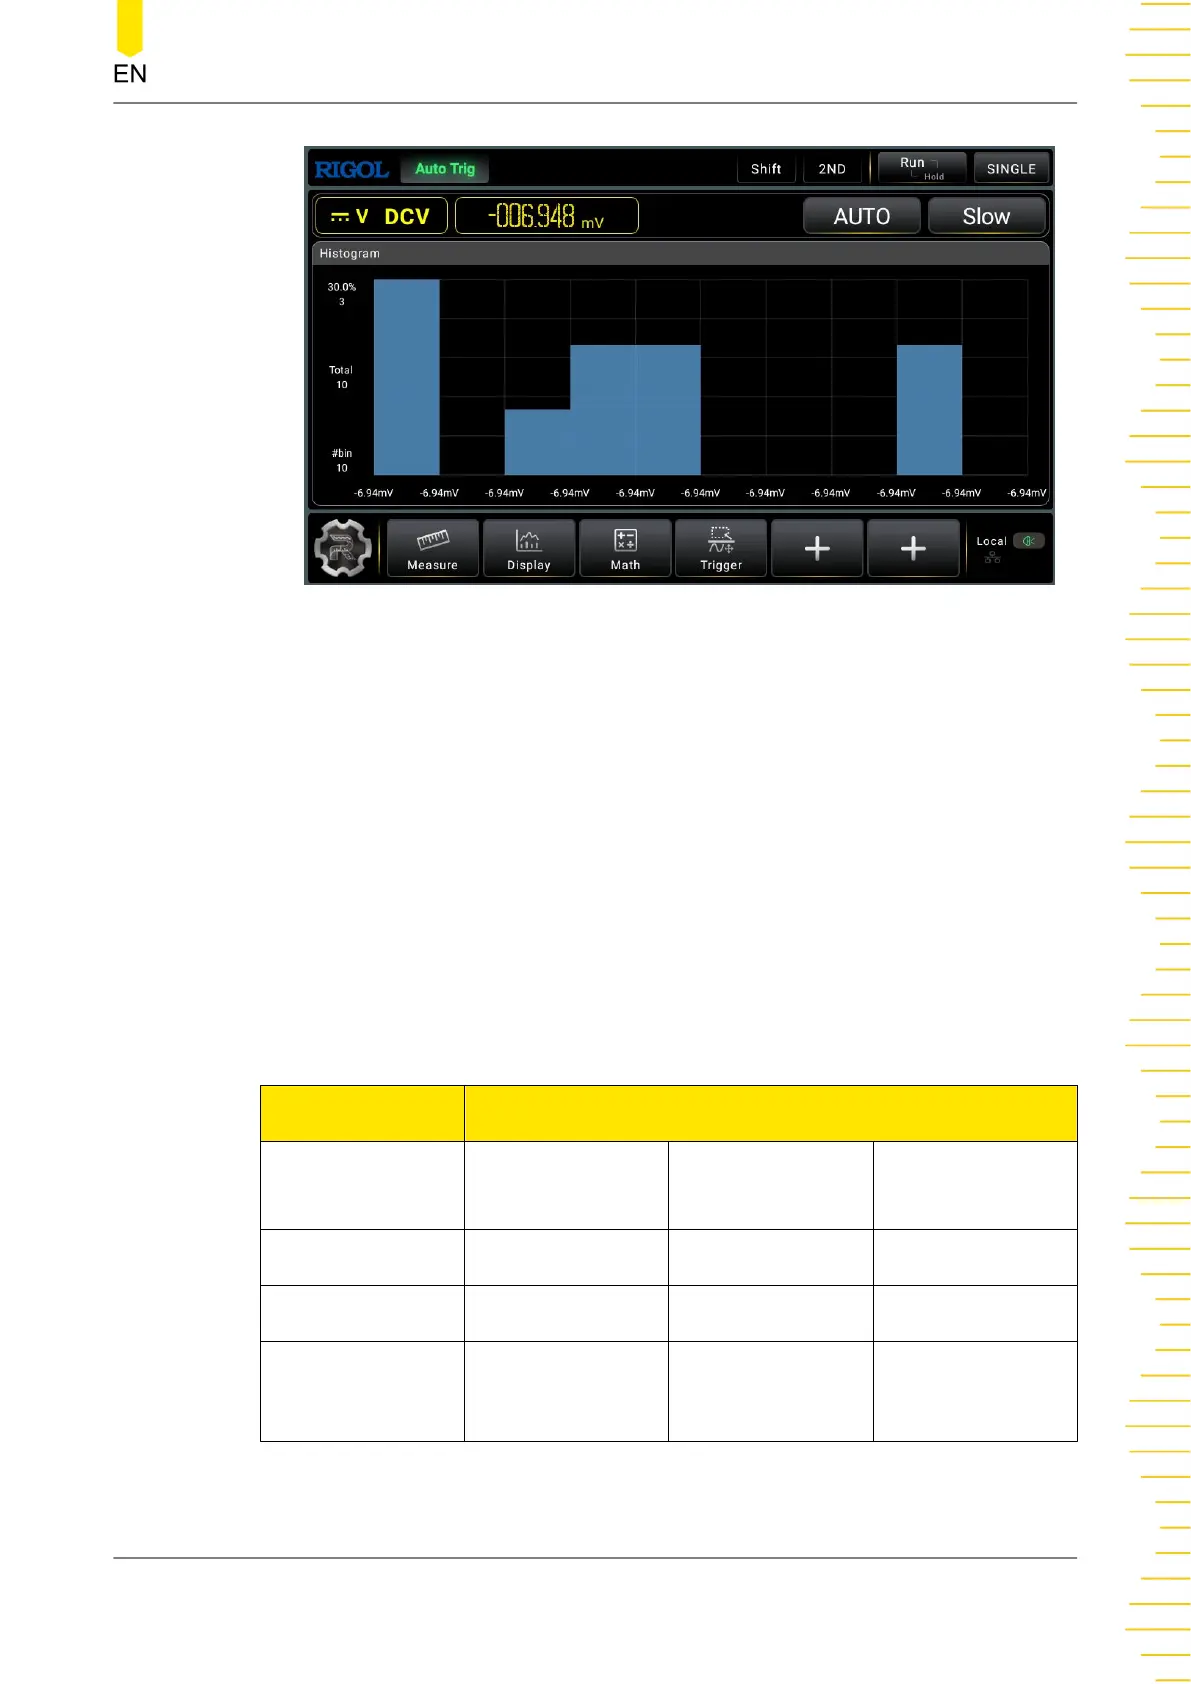
Figure 5.56 Histogram of DCV Measurement
As shown in the figure above, data are grouped in bins represented by vertical
bars in the histogram display. The data are displayed on the left side of the
histogram. Read the data from left downward.
- 82.6%: indicates the percentage of samples in the largest bin.
- 419: indicates the number of samples in the largest bin.
- Total 507: indicates the total number of samples.
- #bin 10: indicates the total number of bins.
For different measurement modes, the max. number of samples supported by the
histogram is different. See the following table for details.
Table 5.21 Max. Number of Samples Displayed in the Histogram
Measurement Rate Max. Number of Samples
Capacitance
Measurement
Frequency/Period
Measurement
Other
Measurements
Slow 61 45 150
Medium N/A N/A 1050
Fast N/A N/A
DM858: 1000
DM858E: 700
The measurement rate for Capacitance, Period, and Frequency measurements is Slow.
Front Panel Operation
Copyright ©RIGOL TECHNOLOGIES CO., LTD. All rights reserved. DM858 Series User Guide
87