- Center: sets the middle value of the vertical scale.
- Range: sets the span of the vertical scale.
- Auto: takes the current measurement range as the span of the vertical scale and
adjusts the span of the vertical scale automatically based on the range of the
measured data.
5. Auto Once
Click or tap Auto Once, the instrument auto adjusts the span of the vertical scale
based on the range of the measured data.
6. Clear
Click or tap Clear to clear the existing reading memory and the data in the trend
graph, and start to acquire new readings to make a new trend.
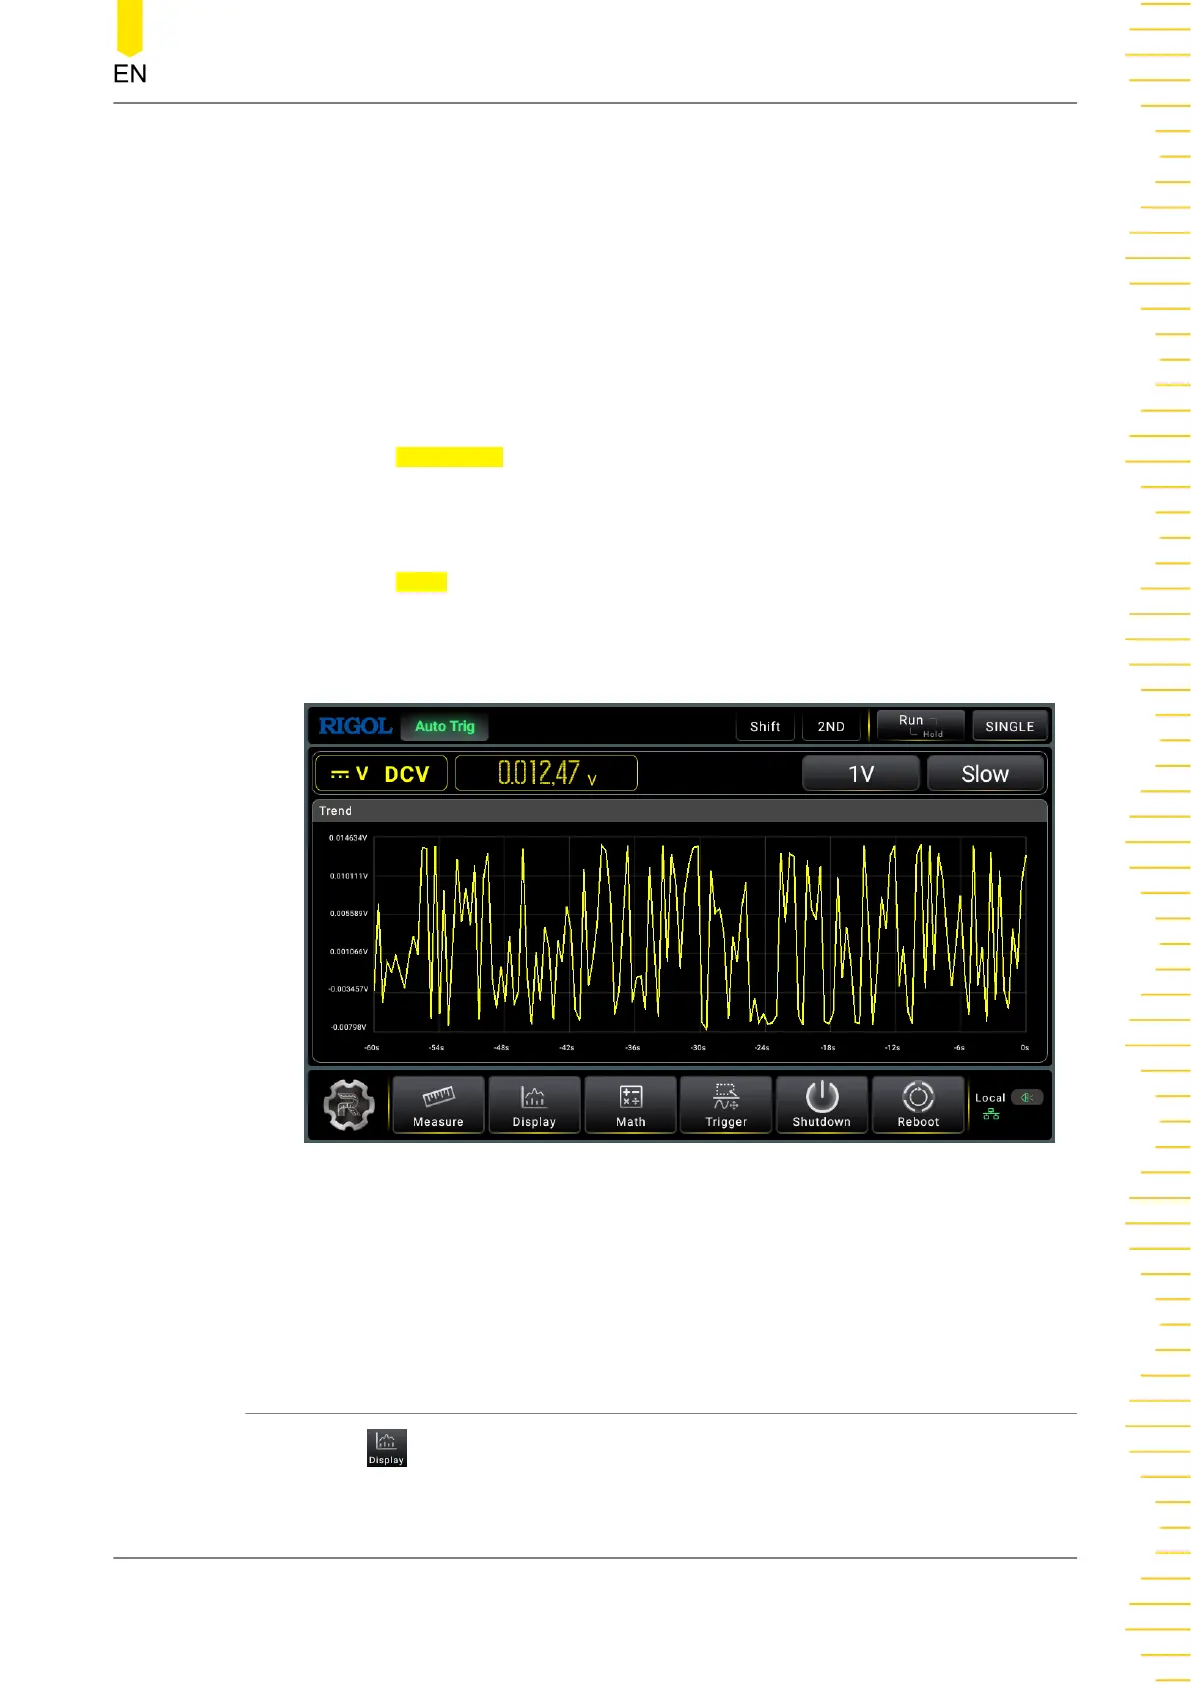
The following figure shows the trend display for the DCV measurement.
Figure 5.52 Trend Graph of DCV Measurement
The measurement rate for Capacitance, Period, and Frequecny is fixed to be Slow.
In Slow and Medium speed, the Trend graph only displays the samples within 60 s; in
Fast speed, the Trend graph only displays samples within 10 s.
5.7.2 Histogram
Click or tap to enter the display interface.
Front Panel Operation
Copyright ©RIGOL TECHNOLOGIES CO., LTD. All rights reserved. DM858 Series User Guide
83