Roche Diagnostics
Operator’s Manual · Version 3.0 87
Multiplate® analyzer 4 Software
Menu options
Export graphics
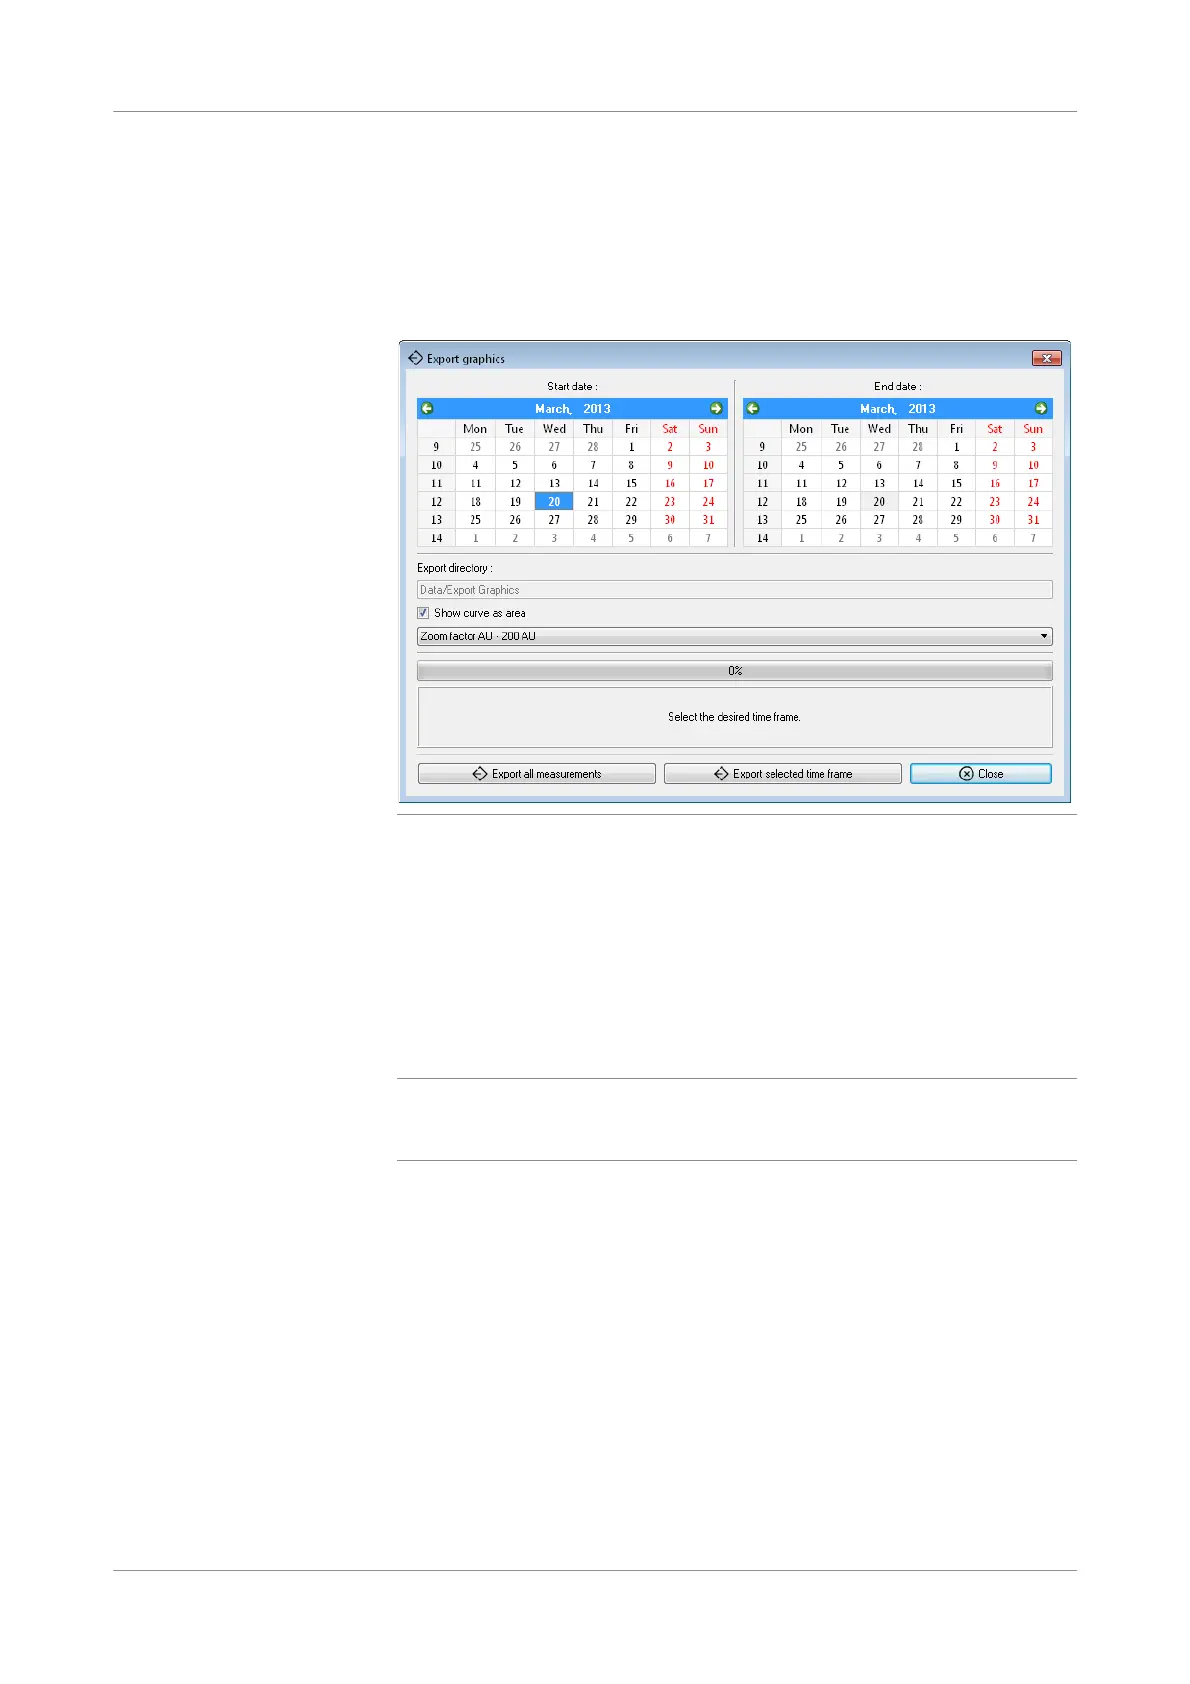
f Tools >Export graphics
You can export graphics using the Export graphics function. If required, previously
saved measurements can be reprocessed to display alternative aggregation unit zoom
factors.
Figure 4-23 Export graphics window
Export directory The export directory is: C:\Multiplate\Data\Export Graphics.
Show curve as area Enable this option to show the measurements as filled curves.
Zoom factor Use the zoom factor to optimize visualization of curves with low aggregation
responses (Level 50 / 75 AU) and a better display of high aggregation curves.
Export all measurements Use to save to the export directory all graphics that are stored on the analyzer.
q
It is not recommended to export all graphics at once. Select a start and end date in the
calendar and export only the selected time frame. Exporting all graphics at once could take
very long!
Export measurements in selected
time frame.
Use to initiate the export process for the graphics of the selected time frame.
Close Use to close the window.