Roche Diagnostics
Operator’s Manual · Version 3.0 153
Multiplate® analyzer 6 Configuration
Configuring the analyzer
Display and printing options
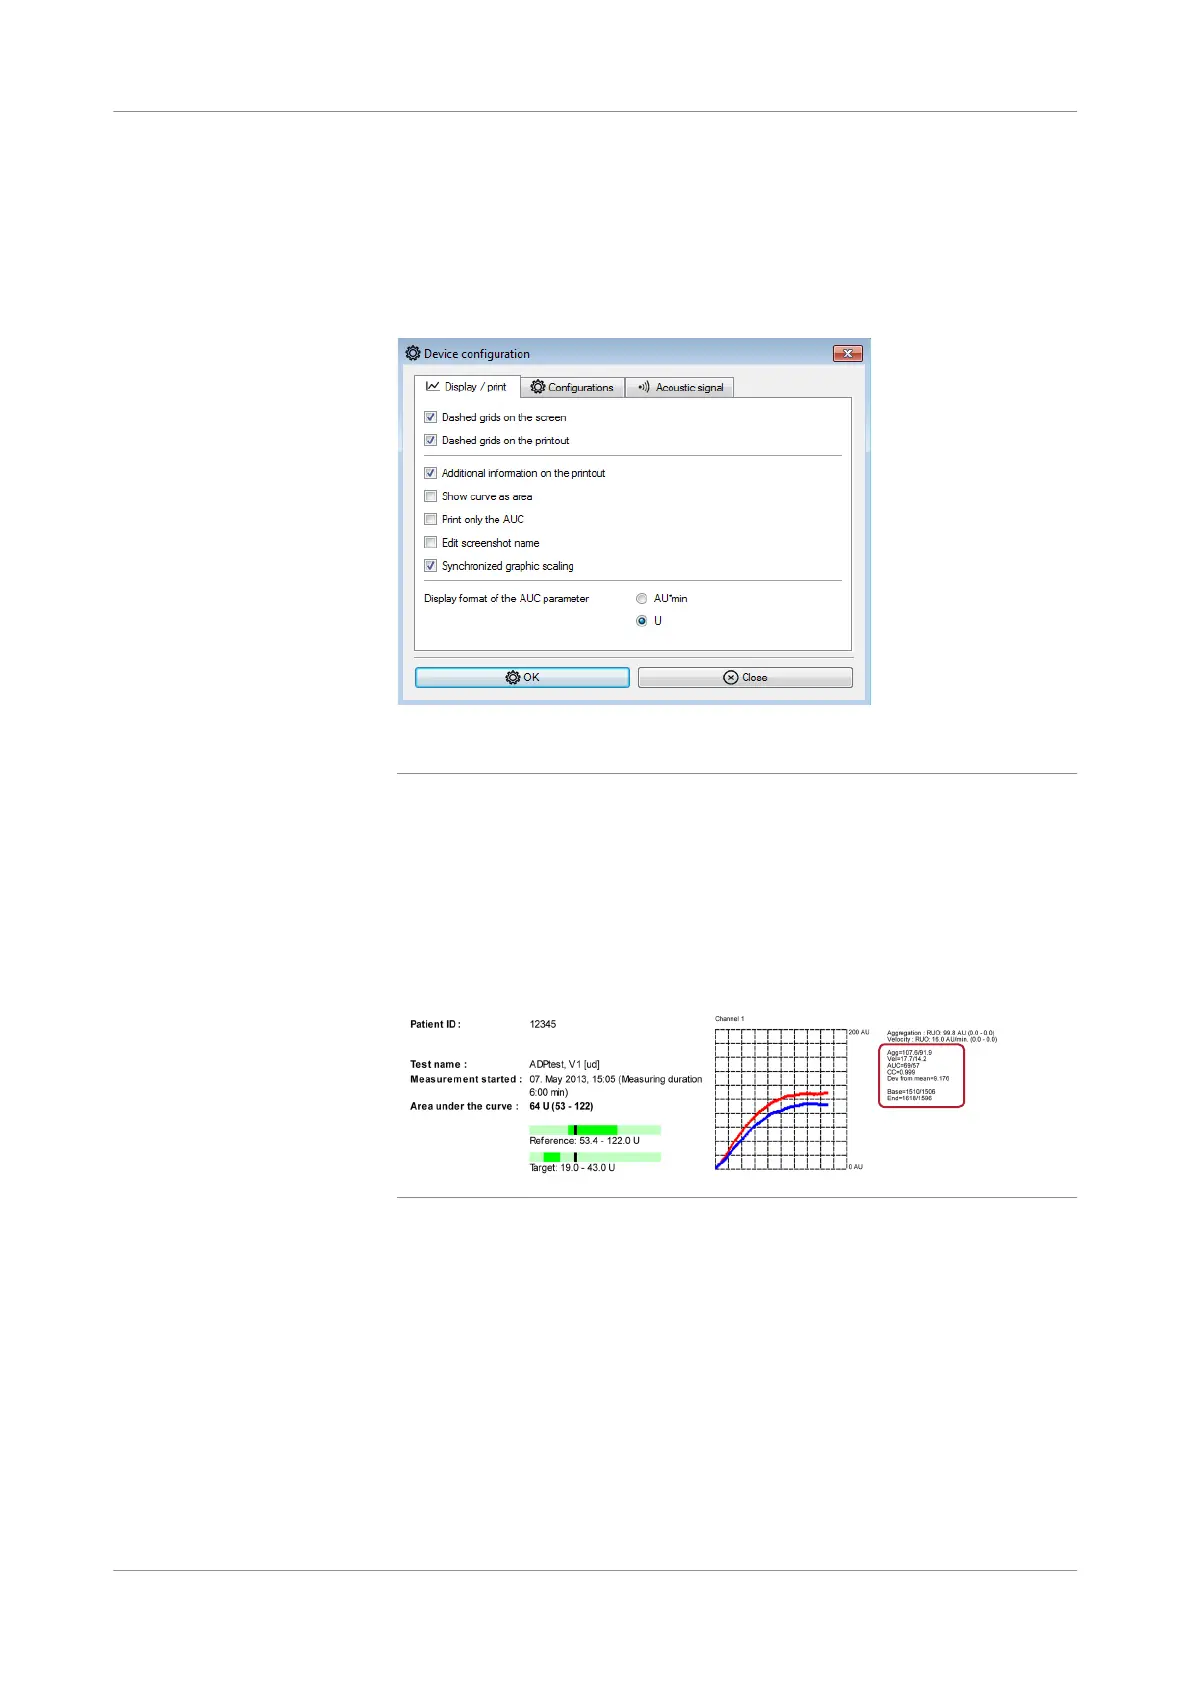
f Configuration > Edit analyzer configuration > Display/Print
The printout and the measurement display can be modified using various
configurations.
Figure 6-4 Display/Print tab
Dashed gr ids on the sc reen
Dashed grids on the printout
If these options are selected, a grid is displayed in the graphic window on the screen
and on the printout.
Additionalinformationonthe
printout
This option switches on individual values for aggregation (Agg), velocity (Vel), and
area under the curve (AUC), as well as the correlation coefficient (CC) and deviation
from the mean (Dev. from mean) plus initial raw data (Base) and the raw data
reading from the final point (End).
Figure 6-5 Example of a printout including additional information.
The AUC value in the detail section of the printout is always presented in AU*min.
Show curves as area This option alters the display mode. The results can be transformed from two
aggregation curves to a mean curve area.
u See Graphic window (p. 73)