Roche Diagnostics
Operator’s Manual · Version 3.0 73
Multiplate® analyzer 4 Software
Main screen
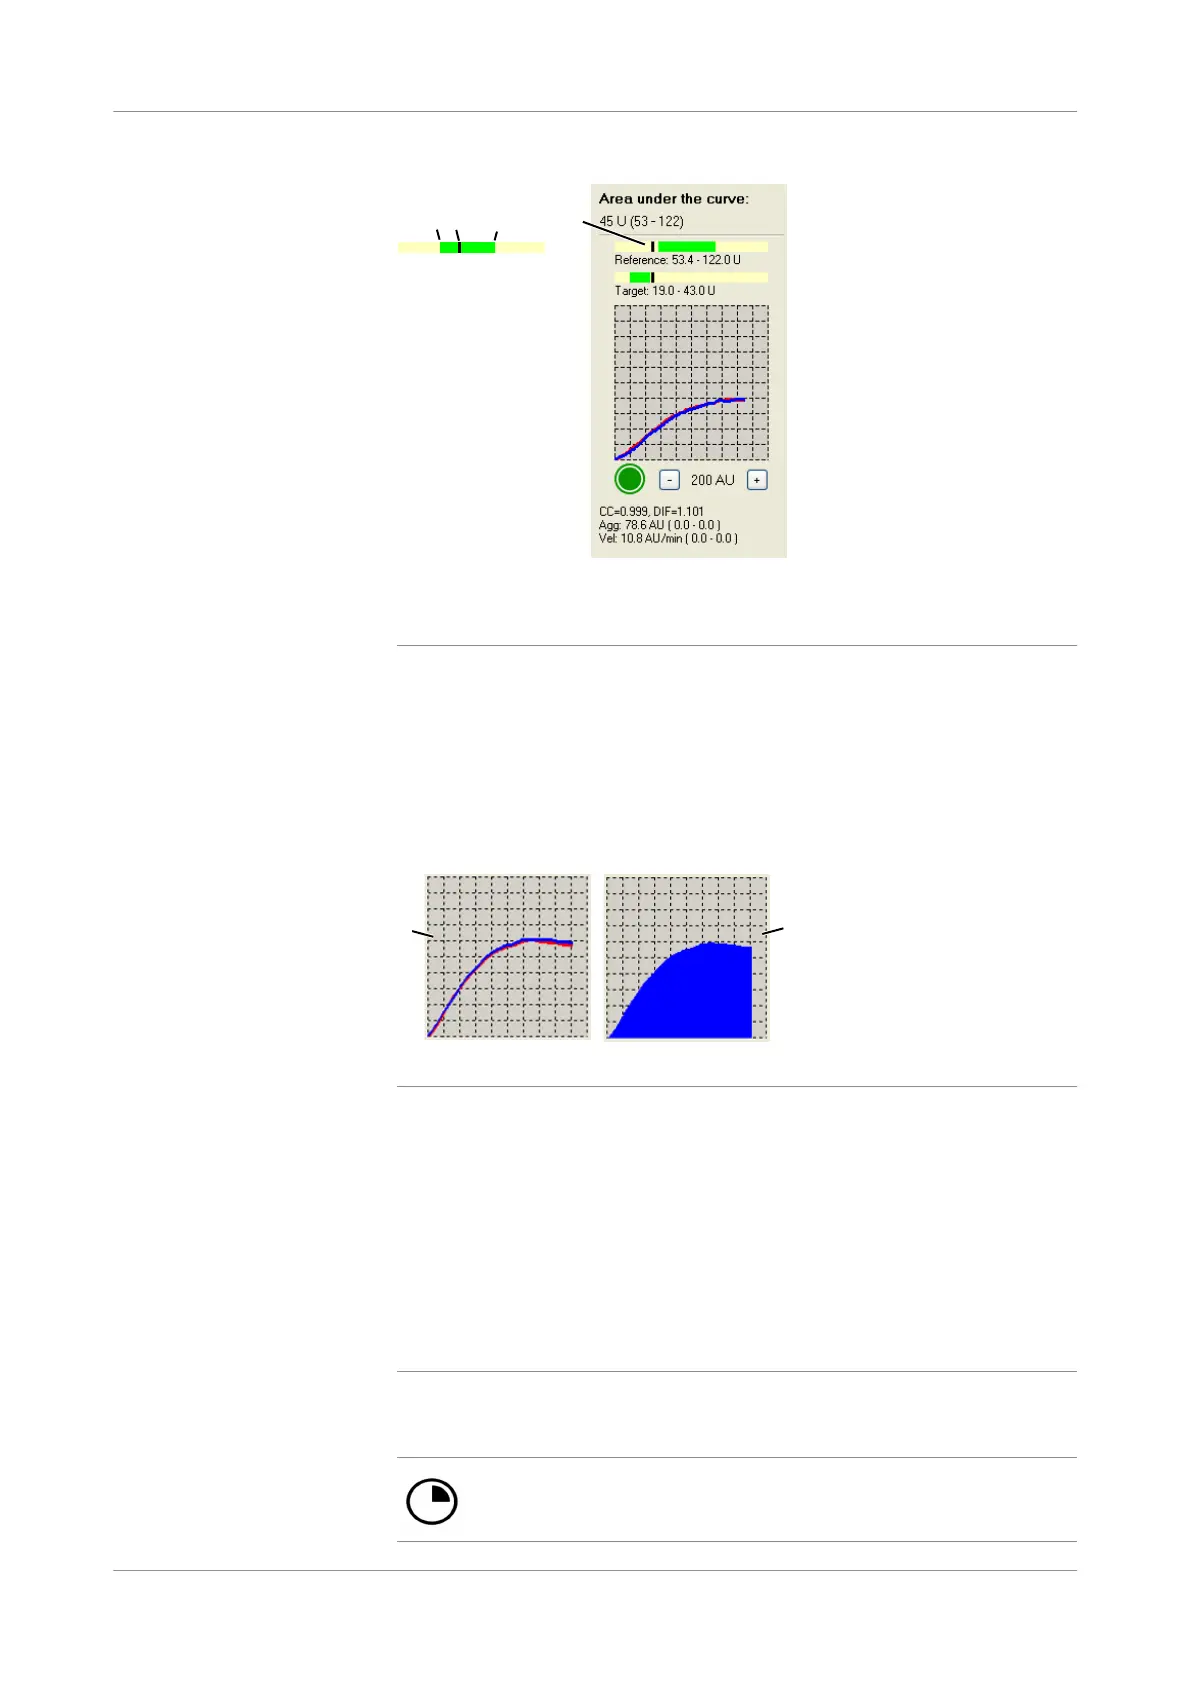
Figure 4-4 Reference range, aggregation below the reference range
u For further information related to the AUC bars see General analyz er configurations
(p. 155).
Graphic window The measurement results are shown in the graphic window. Either two overlapped
curves representing the duplicate sensor measurements (A) or a filled curve reflecting
the mean value of the sensor measurements (B). The type of display depends on the
setting.
Figure 4-5 Display formats for the aggregation signal
Choose Ctrl+K on the keyboard to toggle the display format at any time.
Choose Configuration > Edit analyzer configuration and enable the option Show
curve as area to show filled curves.
u See Show curves as area (p. 153).
The duplicate sensor measurement statistics deviation from mean and correlation
coefficient are internally calculated by the software (see Data alarms (p. 141)).
Status icons The following table lists the possible status icons.
A Lower end of reference range C Upper end of reference range
B Current AUC measurement result D Inhibited platelets show the black bar below
the lower end of the reference range
D
A
B C
A Overlapped curve B Filled curve
A B
No icon: the channel is ready for a new measurement.
Measurement has been started. Measurement progress is indicated.