Chapter 12 - System Safety and Maintenance Acoustic Output Indices
Terason t3000 / Echo Ultrasound System User Guide 273
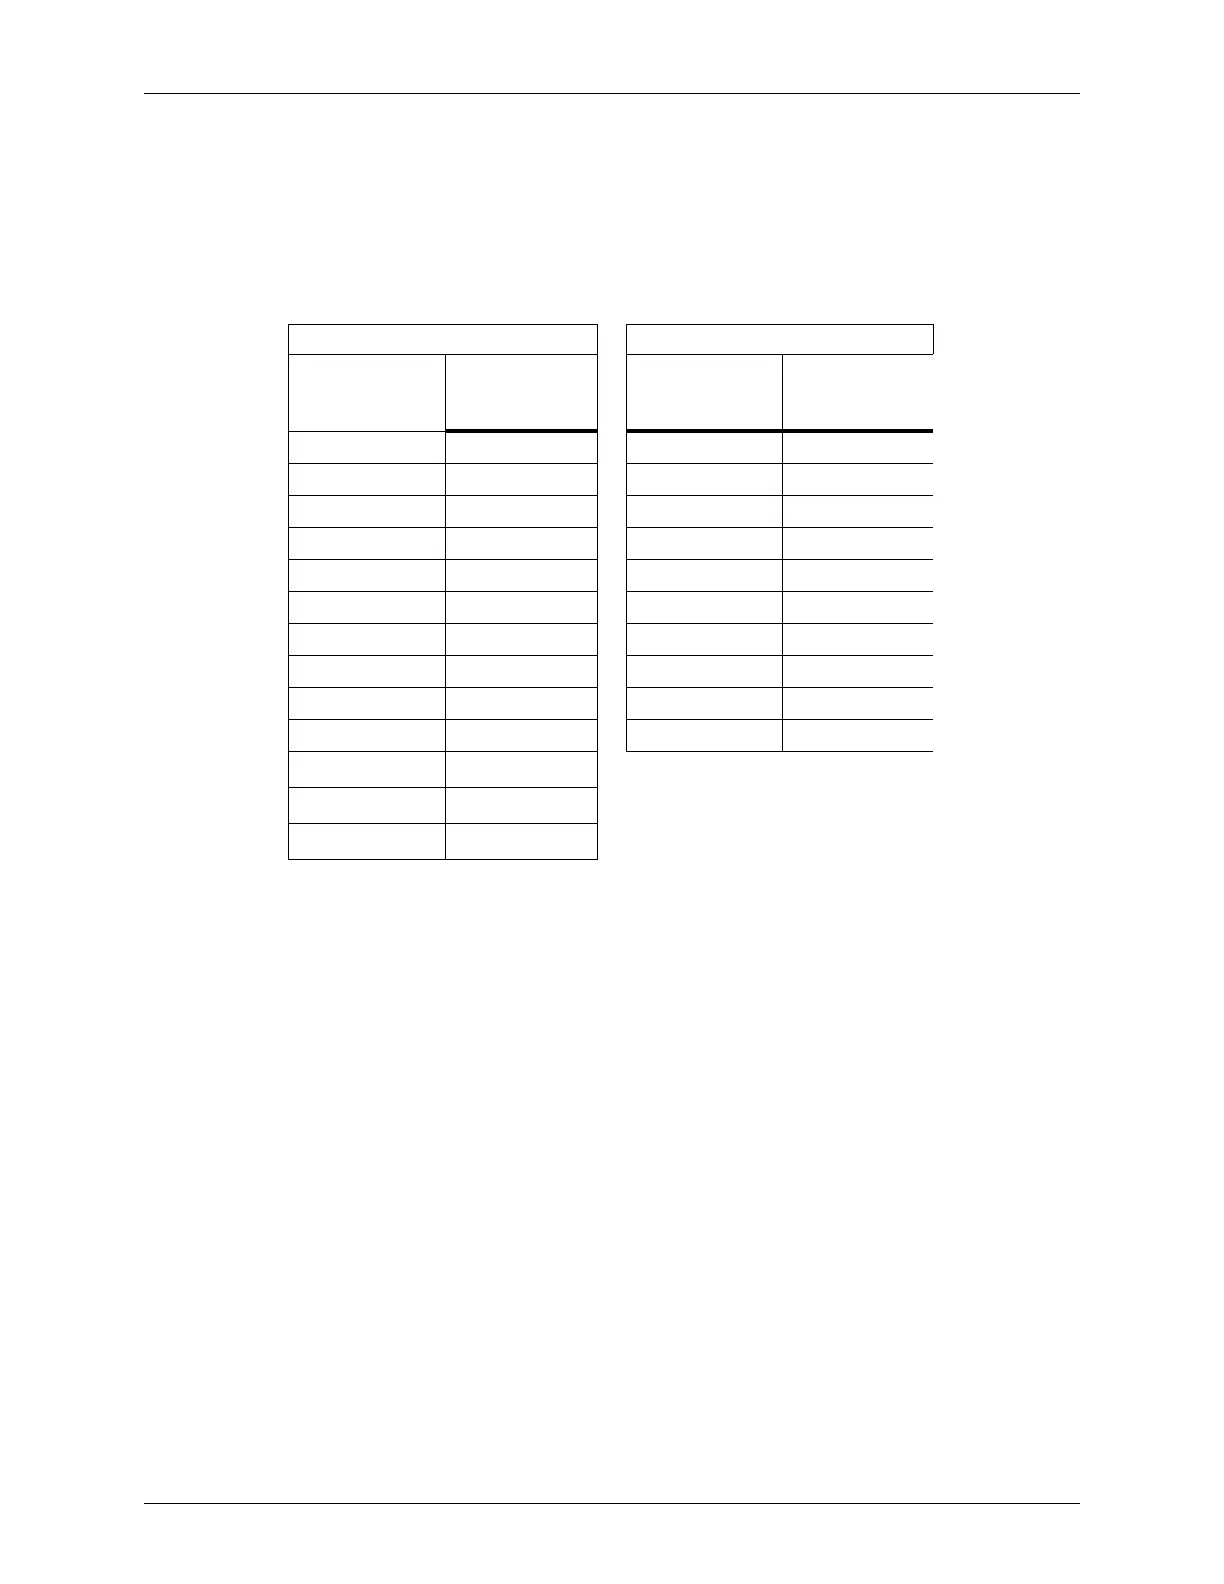
For any transducer in which one or more relevant indices are displayed, some control
settings may produce an index value greater than 1.0. For those indices, real-time values
are displayed, to allow monitoring and control. The displayed indexes may take on the
following values (shown along with the corresponding labels, where
x indicates the actual
calculated index value):
In all operating modes with the Terason Ultrasound System, control of acoustic exposure
is available indirectly. For a description of the indirect effects that certain control
adjustments may have on displayed index values, consult Chapter 5 - Working With Scan
Modes for information on the particular operating modes.
Accuracy of Acoustic Output Display
The acoustic output display indices are calculated on the basis of measured values of
acoustic parameters (acoustic power, intensity, pressure, etc.). The accuracy of the indices
(discussed in the Standard for Real-Time Display of Thermal and Mechanical Acoustic
Output Indices on Diagnostic Ultrasound Equipment) described below refers to accuracy
of the measurement of the acoustic parameters and the effect of these errors on the
estimated index values. (For a discussion of statistical considerations in acoustic
measurement, refer to “Measurement Uncertainty in Ultrasonic Exposimetry”, in
Ultrasonic Exposimetry, M. C. Ziskin and P. A. Lewin, eds., CRC Press).
Acoustic Index Parameters
Display of TI Values Display of MI Values
Range of
calculated value
x
Calc.
Displayed value
x
Display
Range of
calculated value
x
Calc.
Displayed value
x
Display
x < 0.4 < 0.4 x < 0.4 < 0.4
0.4 x < 0.5 0.4 0.4 x < 0.5 0.4
0.5 x < 0.7 0.6 0.5 x < 0.7 0.6
0.7 x < 0.9 0.8 0.7 x < 0.9 0.8
0.9 x < 1.1 1.0 0.9 x < 1.1 1.0
1.1 x < 1.3 1.2 1.1 x < 1.3 1.2
1.3 x < 1.5 1.4 1.3 x < 1.5 1.4
1.5 x < 1.7 1.6 1.5 x < 1.7 1.6
1.7 x < 1.9 1.8 1.7 x < 1.9 1.8
1.9 x < 2.25 2.0 x = 1.9 1.9
2.25 x < 2.75 2.5
x < 3.25 3.0
Etc. Etc.