Chapter 7 - Working With Measurements Measuring Vascular Exams
Terason t3000 / Echo Ultrasound System User Guide 175
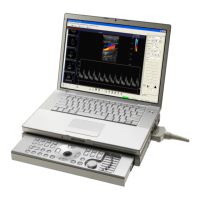
Flow Measurement on a PWD Scan
The red tracing indicates the waveform used to calculate these values. The
measurement is calculated from the diastolic end of one cycle to the diastolic end of
another cycle as indicated by the green vertical bars. The blue = on the ultrasound
cursor in the 2D window indicates the size and location of the range gate.
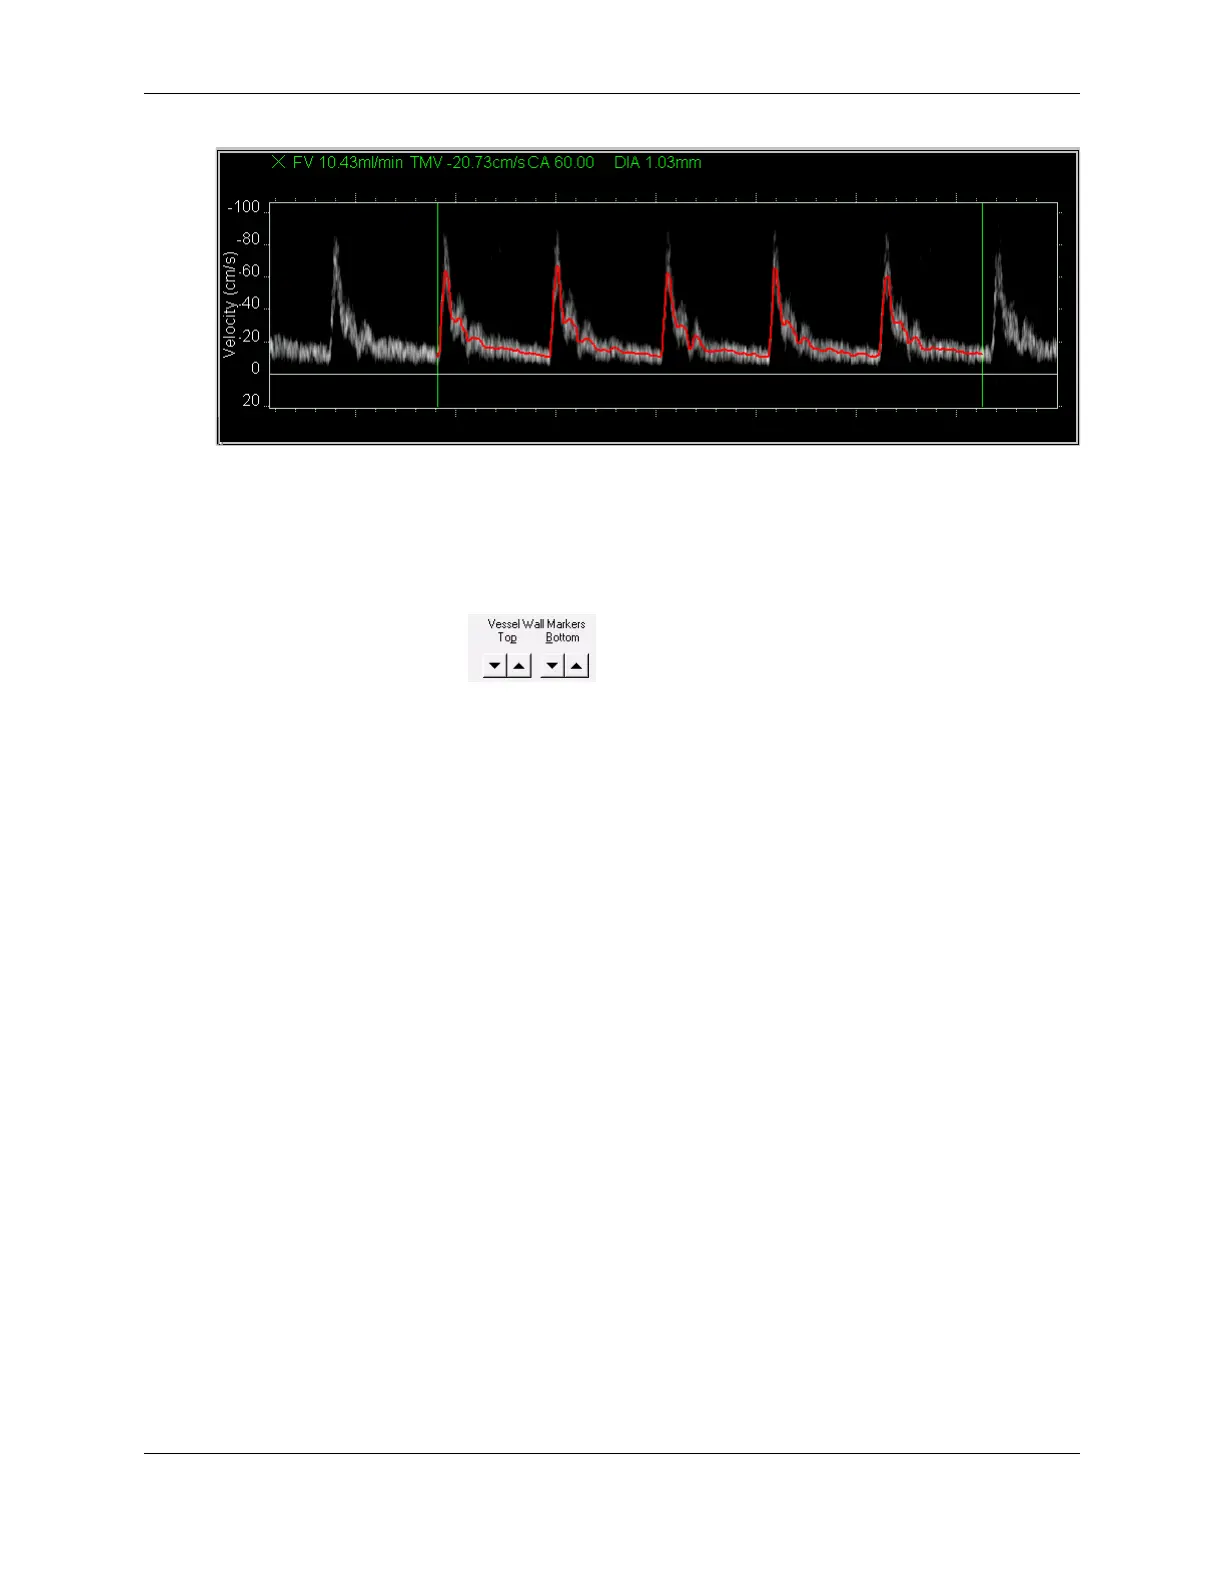
4. Use the arrows, , to adjust the size of the range gate to encompass the
entire vessel from wall-to-wall. The Terason software updates the DIA and FV
calculations for each change of size of the range gate.
5. To adjust the start or end locations of the measurement to include fewer or more
cycles on the waveform, click the green bar, move to another end diastolic location,
and click.
Measuring Vascular Exams
When you make a measurement in the 2D Image Display window, the measurement value
displays at the bottom left of the window. If you make a series of measurements that result
in the Terason software calculating another value, the calculated values display at the
bottom left of the window.
The Terason software provides Vascular measurements for the 2D image display window,
the M-Mode Time series window, and the Spectral window. These measurements can then
be viewed in a report (see Working with Vascular Reports on page 181.)
Vascular Measurement Lists
The Terason software includes default lists of commonly-used measurements that are
available in the Measurement pull-down menu on the Image Control panel when an image
is frozen, and the measurements included in the selected list display in the field below that
menu. The lists for each exam include different measurements. You can add or remove
measurements from lists.