B-52 The MassLynx Tune window
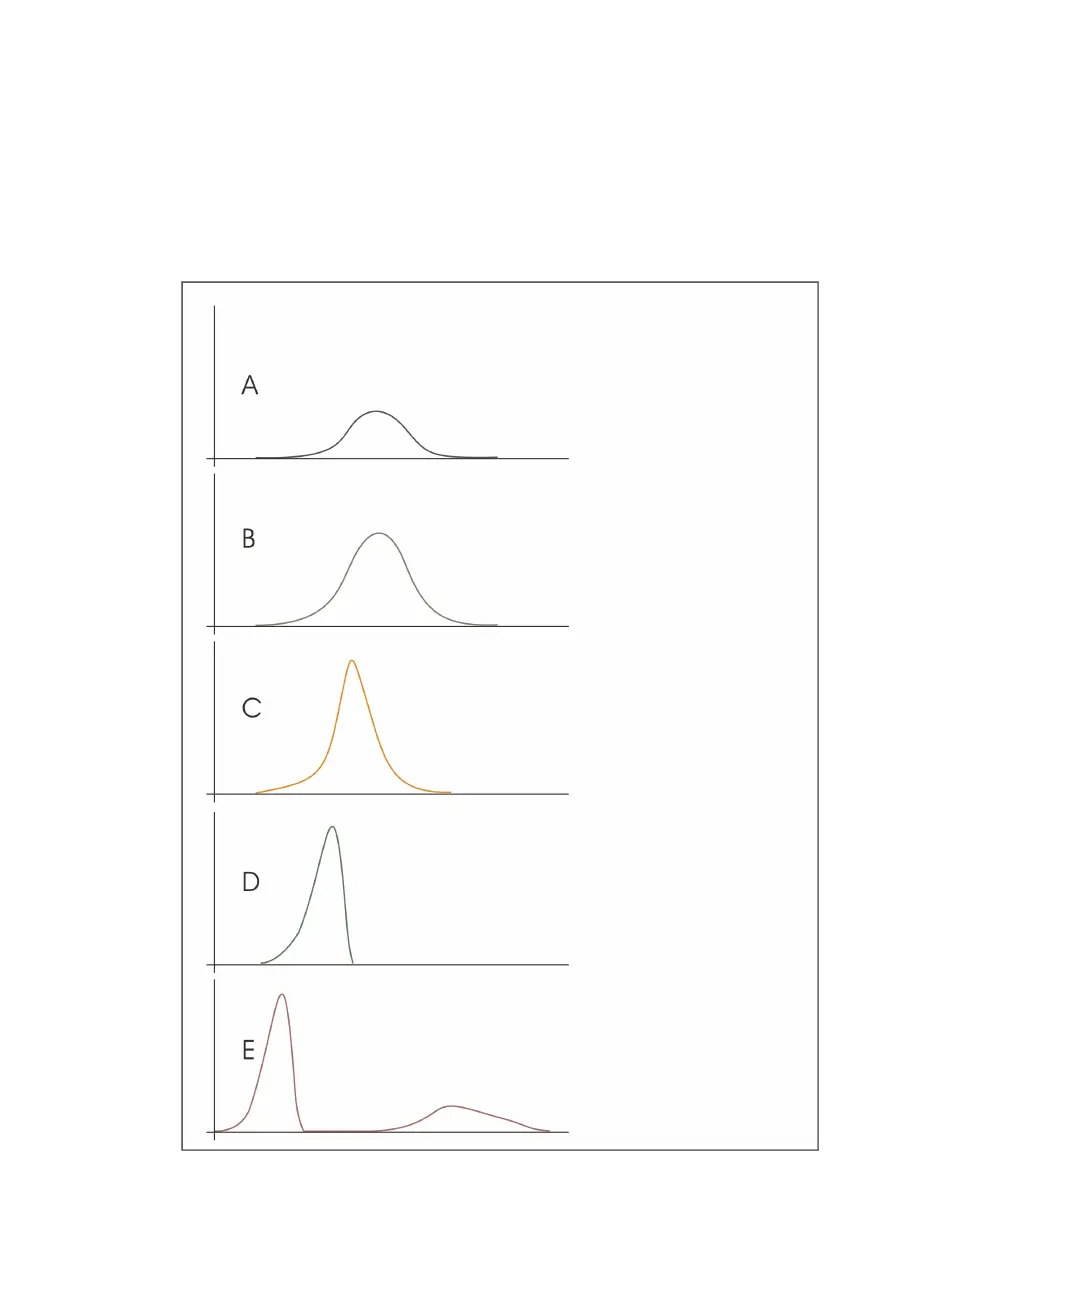
Example E in Figure titled “Schematic diagram of peak shape saturation
effects:” on page B-52 displays the effect of dead-time saturation. You can
adjust the Np Multiplier and Resolution fields in the TDC Settings dialog box
to correct the effect of dead time saturation.
Schematic diagram of peak shape saturation effects:
A and B show
peaks within the
dynamic range.
C, D, and E show
saturated peaks.
Note: The shift to
lower mass, peaks
narrowing and
sharp cut-off.
E shows a
secondary peak due
to saturation.