7.2 Displaying Waveforms
Procedure
Displaying Waveforms
1.
Press WAVE. The waveform display appears.
Explanation
For an explanation of the waveform display feature itself, see section 2.7.
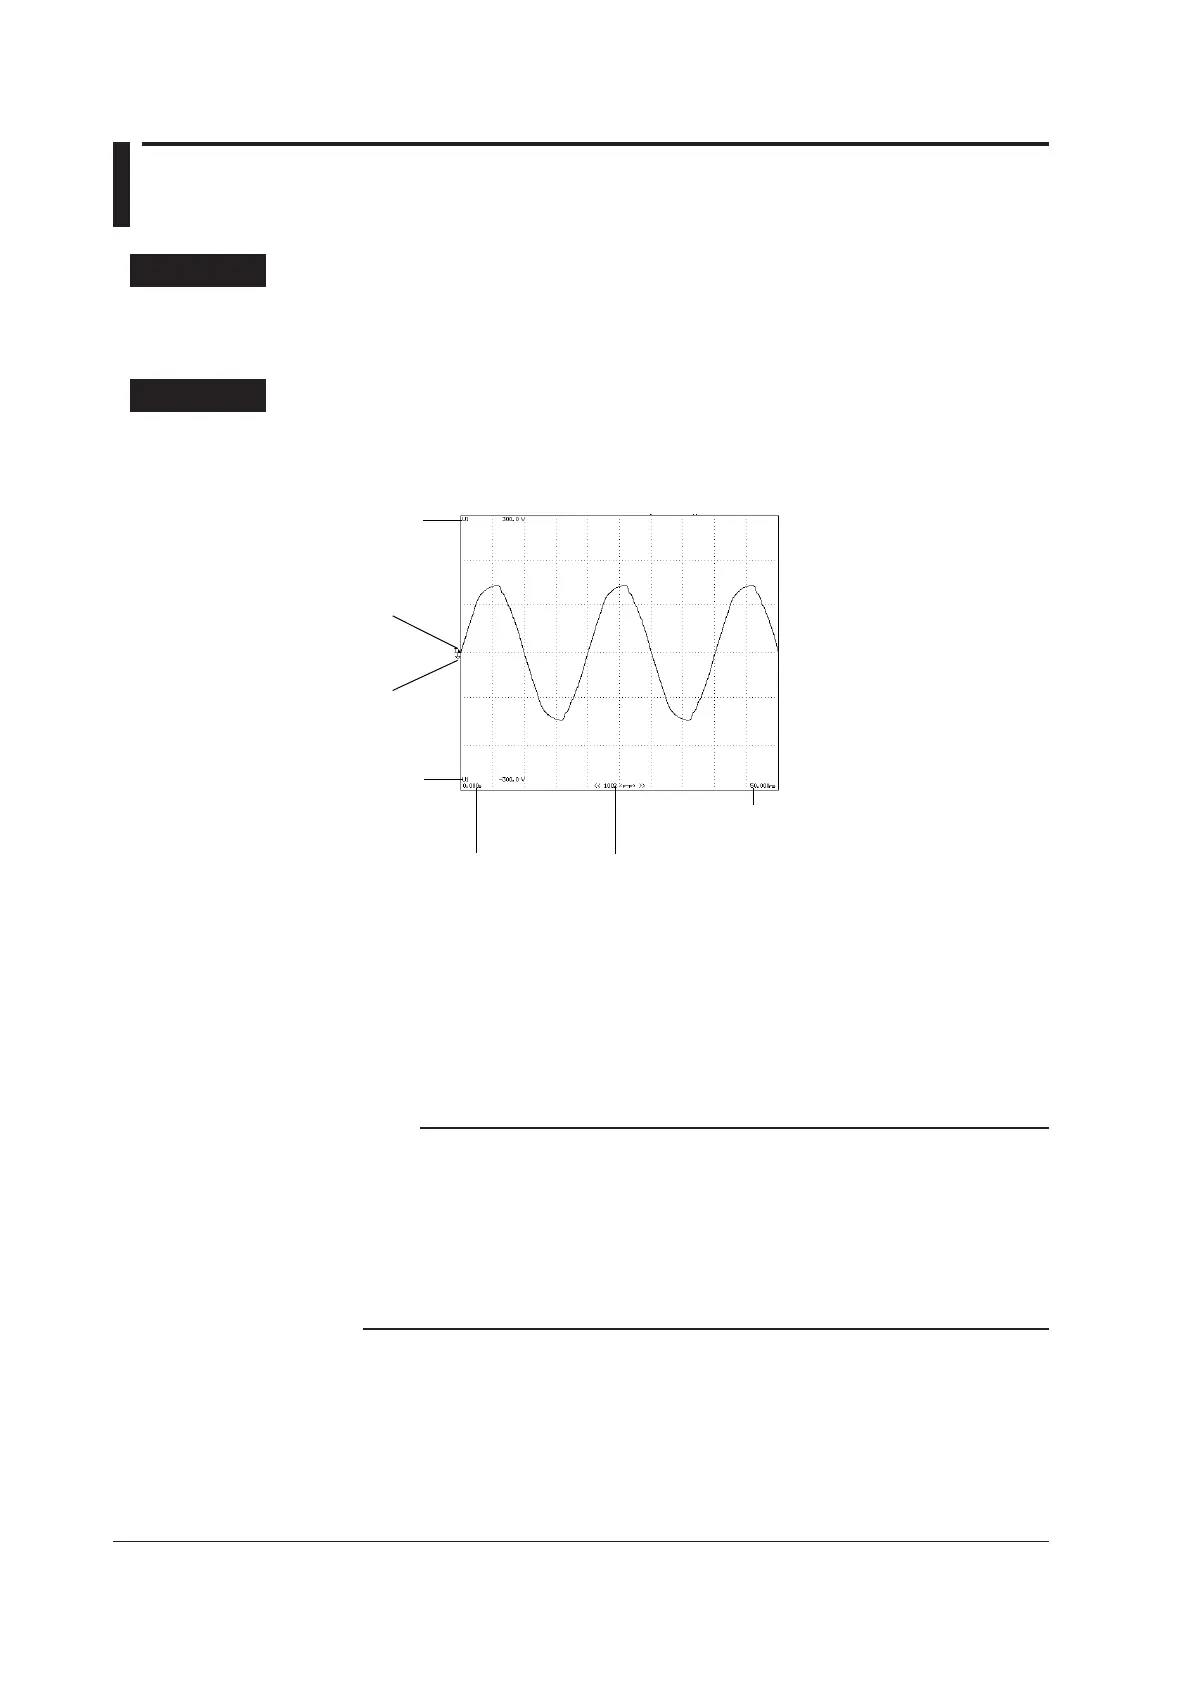
A display example is shown below. For instructions on how to change displayed
waveforms and their formats, see sections 7.3 to 7.9.
Time at the right edge of the screen
(amount of time contained in the screen)
Time at the left edge of the screen
(fixed at 0 seconds)
• The number of data points between the
left and right edges of the screen.
• “P-P” indicates that the displayed
waveform has been P-P compressed
(see section 2.7 for details).
The measurement function,
the element number, and the
upper limit of the displayed
waveform
The measurement function,
element number, and lower
limit of the displayed
waveform
Trigger level
Ground level
Measurement Mode during Waveform Display
When waveforms are displayed, the measurement mode indicated in the upper left of
the screen is Normal Mode (Trg). After a trigger occurs (see section 7.4 for details),
measurement takes place at the data update interval.
Note
• If you do not set the trigger level properly, the waveform display start point (the signal level
on the left edge of the screen) may be unstable, or waveforms may not appear.
• Even when waveforms are displayed, during integration (including when integration is
suspended), the measurement mode indication at the upper left of the screen is Normal
Mode. In this mode, sampled data is updated automatically at a set interval, and the trigger
feature does not function. Therefore, the waveform display start point (the signal level at the
left edge of the screen) may not be stable. Also, the numeric data measurement period may
not be synchronized with the waveform data measurement period.
 Loading...