6-15
IM 760201-01E
Harmonic Measurement (Optional)
3
2
1
4
5
6
7
8
9
10
11
12
13
14
App
Index
6.7 Displaying Bar Graphs and Making Cursor
Measurements
Procedure
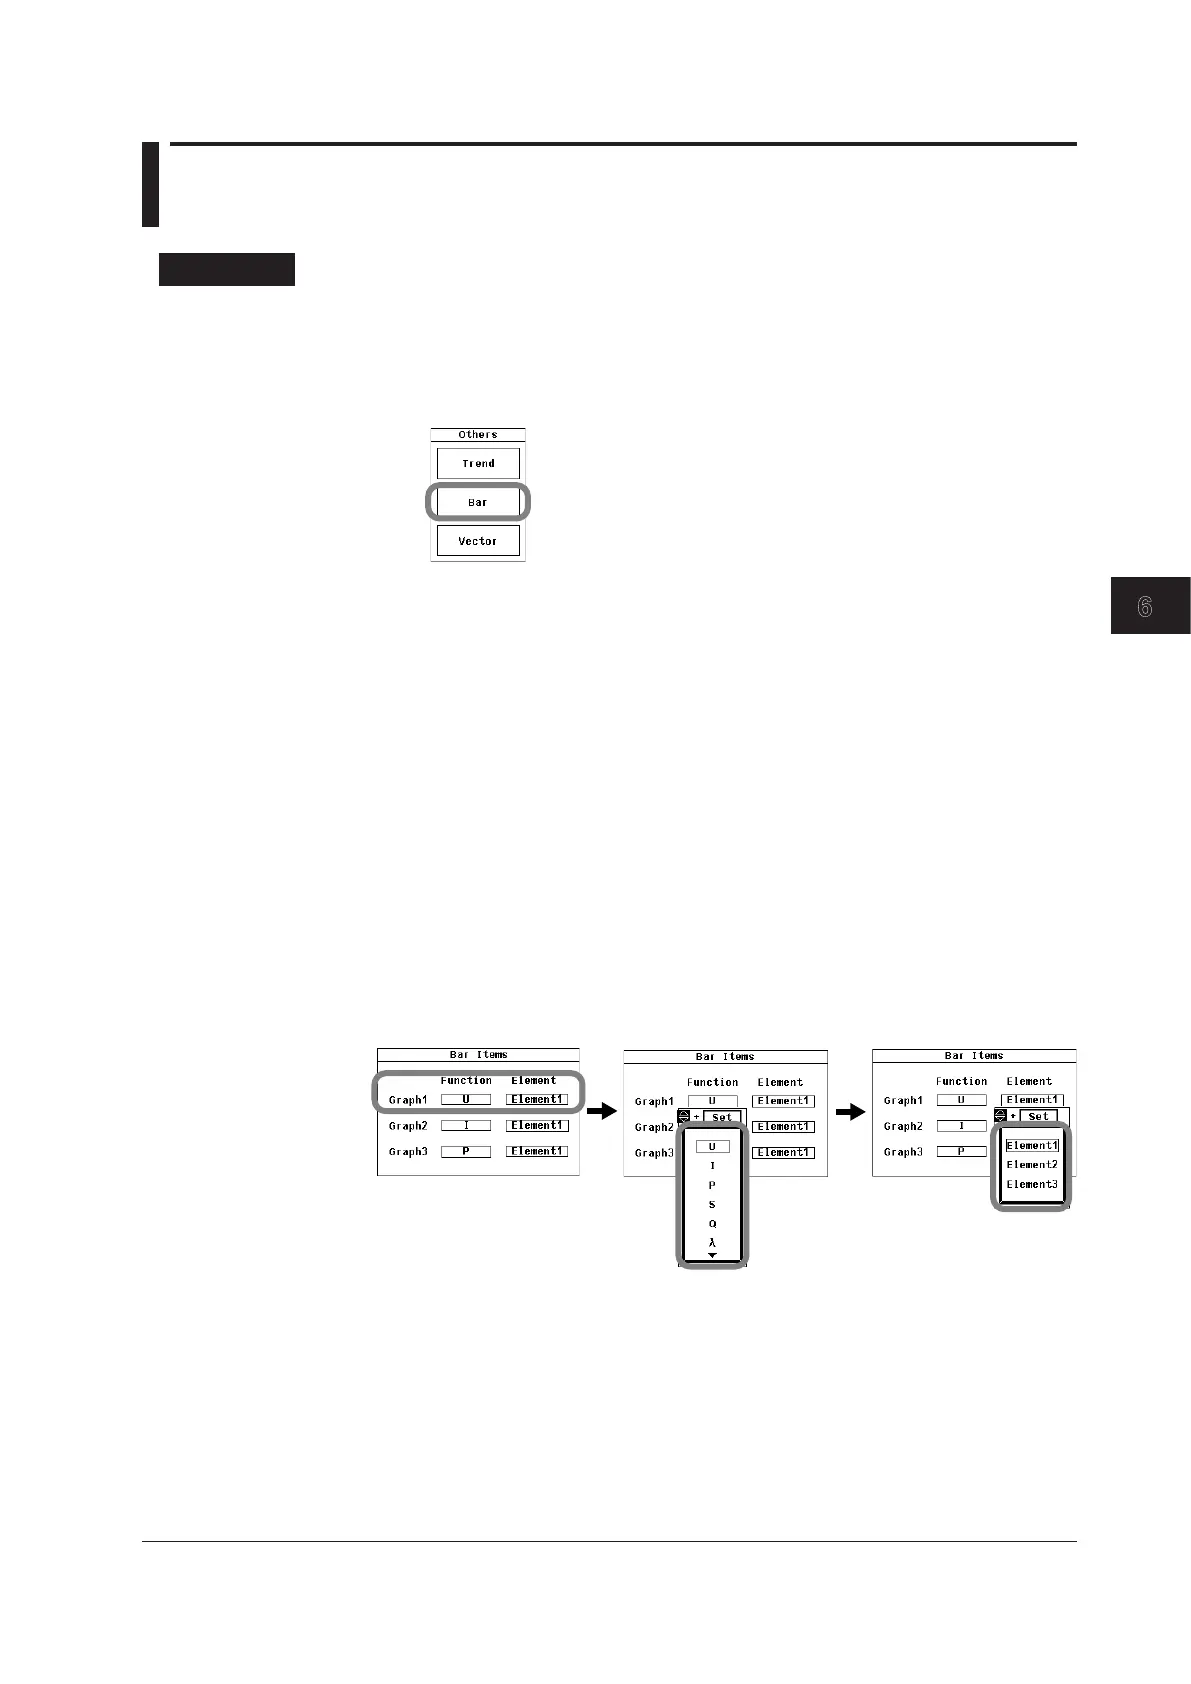
Displaying a Bar Graph
1.
Press OTHERS to display the Others menu.
2.
Use the cursor keys to select Bar.
3.
Press SET to confirm the selection.
Changing a Measurement Function
4.
Press ITEM to display the Bar Items menu.
5.
Use the cursor keys to select the Function of the bar graph (Graph1 to Graph3)
that you want to set.
6.
Press SET to display the measurement function selection box.
7.
Use the cursor keys to select a measurement function.
8.
Press SET. The symbol for the selected function is displayed on the screen along
with its bar graph.
Changing the Graphed Element
9.
Use the cursor keys to select the Element of the bar graph (Graph1 to Graph3)
that you want to set.
10.
Press SET to display the element selection box.
11.
Use the cursor keys to select an element.
12.
Press SET. The bar graph for the selected element appears on the screen.
 Loading...