1.
2.
3.
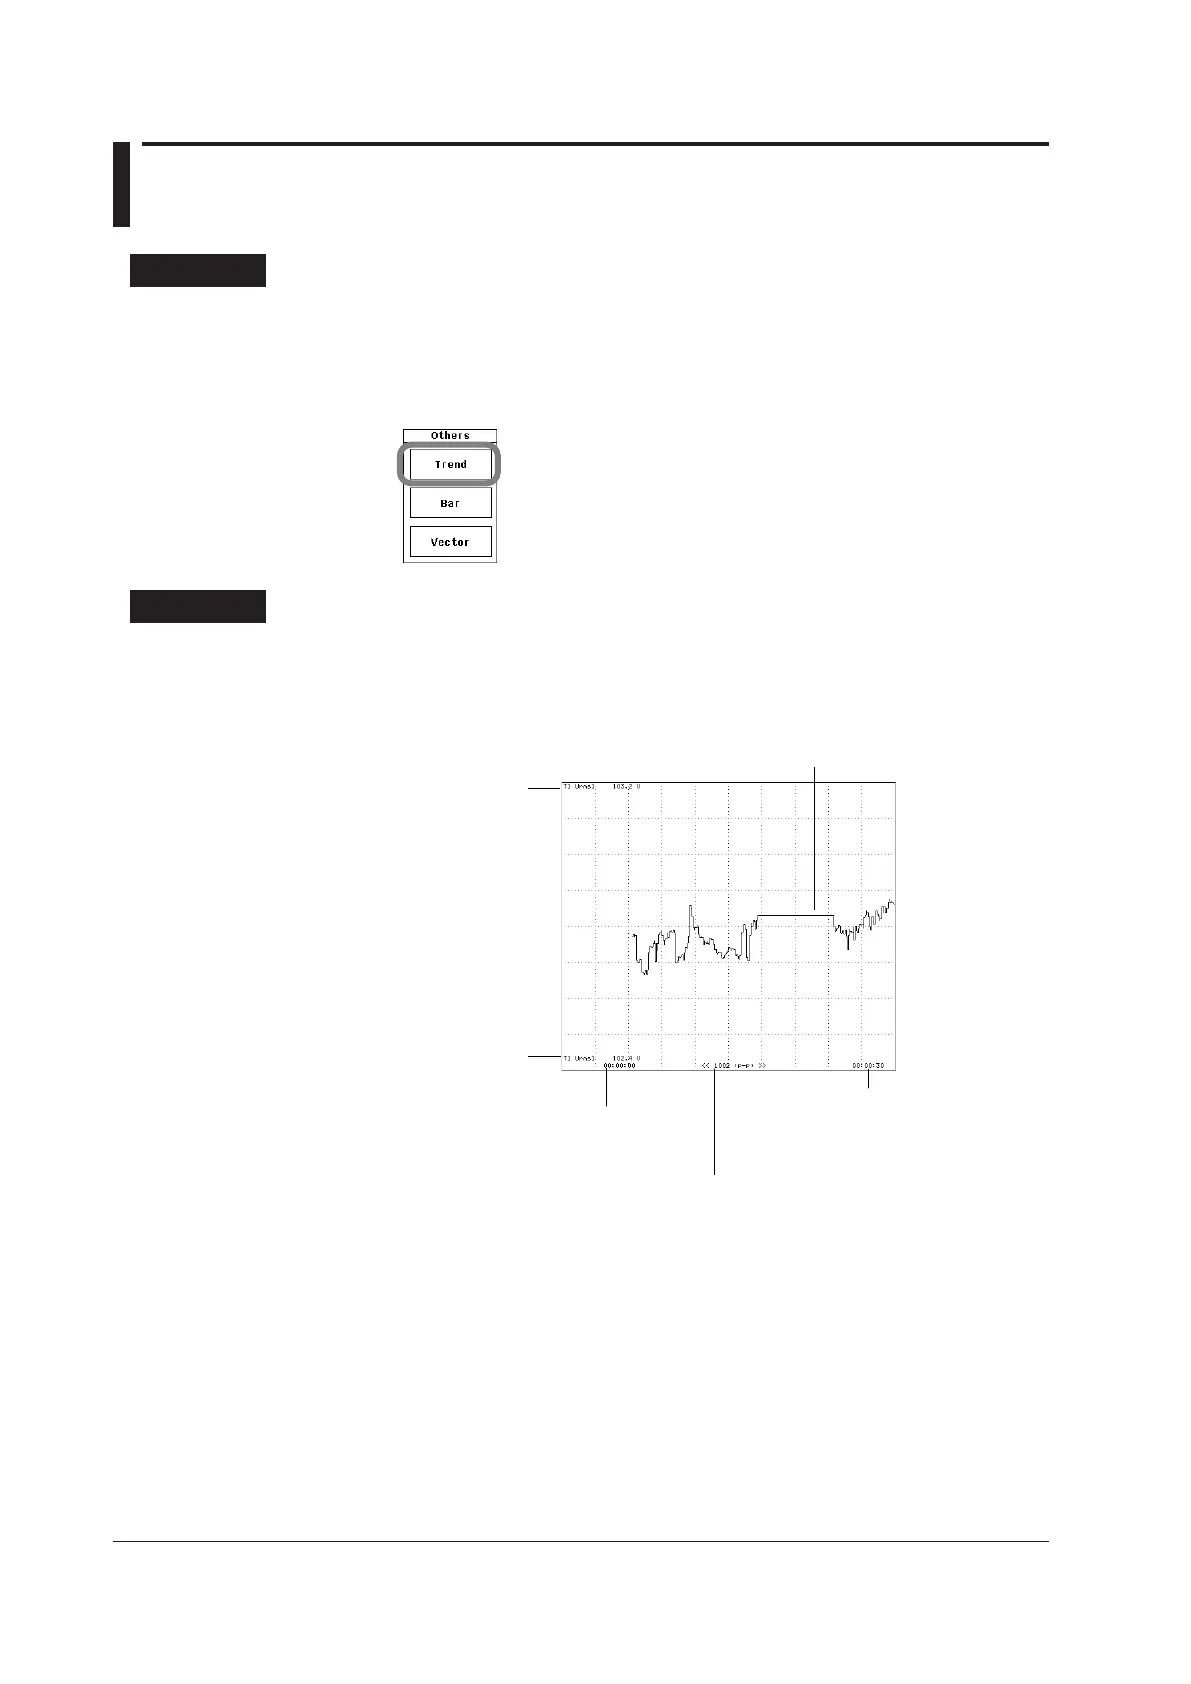
represents time.
Time at the right edge
of the screen
(amount of time contained
in the screen)
Time at the left edge of the screen
(fixed at 0 seconds)
• The number of data points between the
left and right edges of the screen.
• “P-P” indicates that the displayed
waveform has been P-P compressed
(see sections 2.7 and 2.8 for details).
The displayed trend, the
measurement function,
and the upper limit
The displayed trend, the
measurement function,
and the lower limit
When the display is held (see section 4.12 for details),
trend values behave the same as numeric values.
When the display is un-held, the trend data from
when the display was held appears.
 Loading...