Appendix A
551
Sampling and Averaging
Sampled signals differ from analog signals.
An example may be helpful to understand what happens when we
sample a signal.
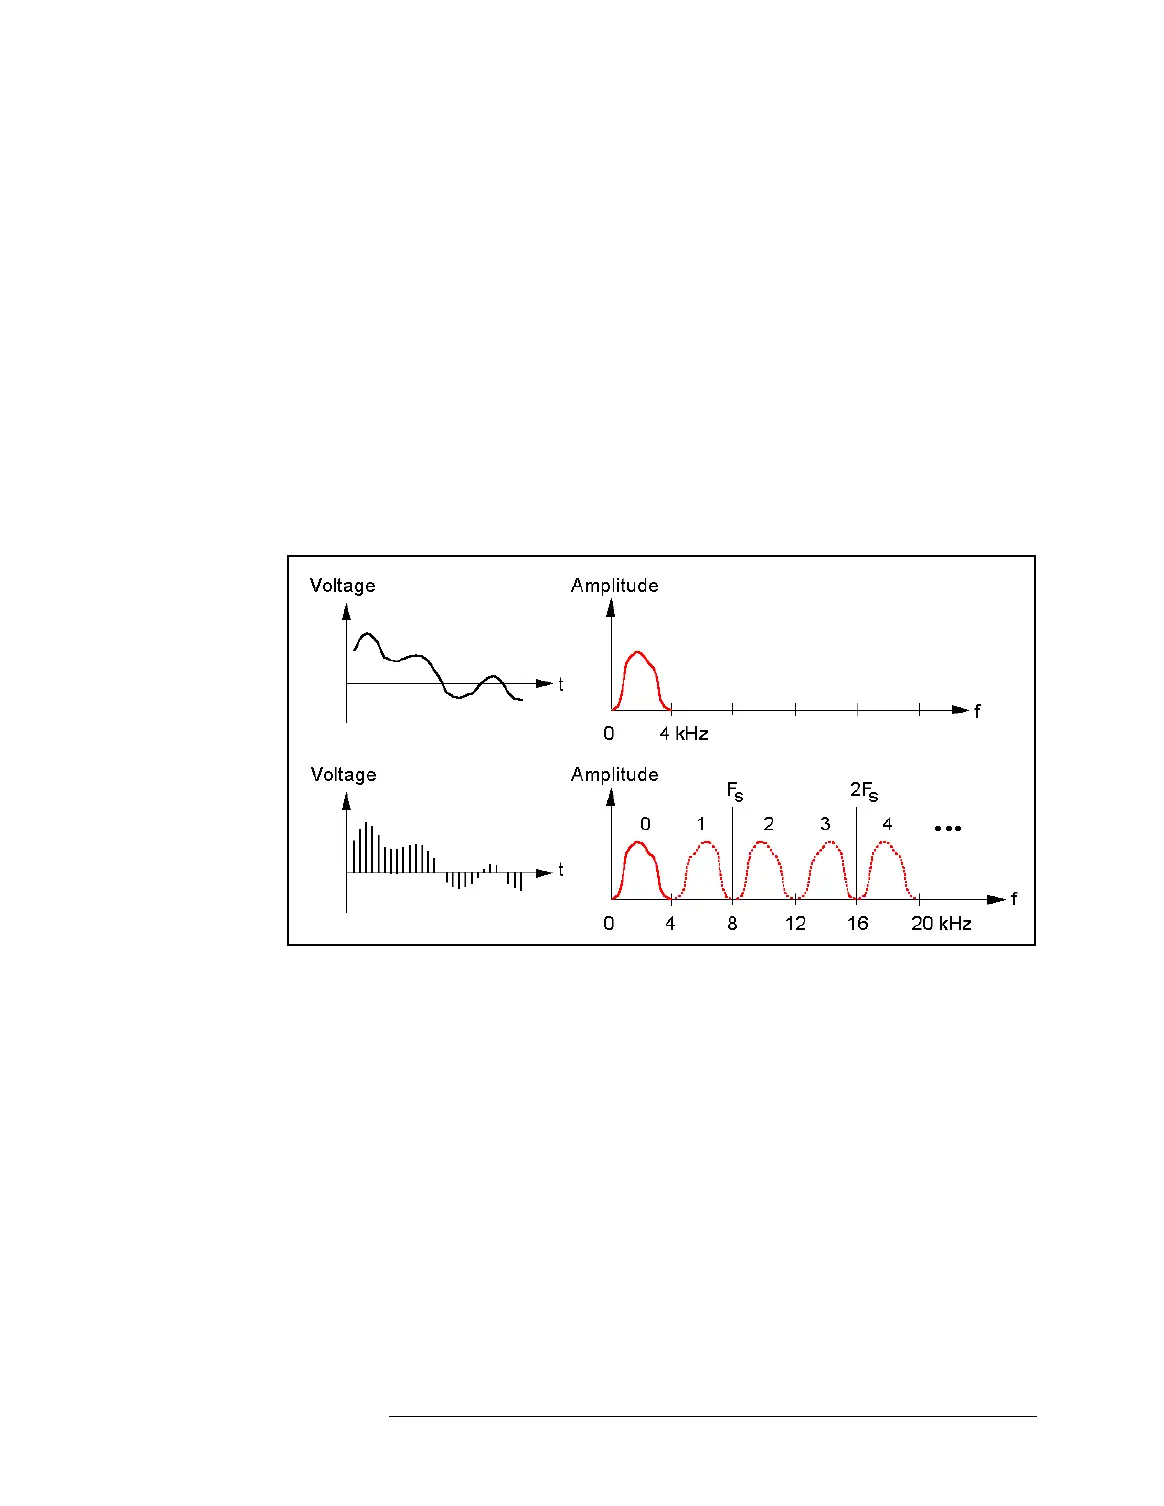
Let us consider a speech signal that has been filtered by a
bandpass with a lower frequency of 300 Hz and an upper
frequency of 3400 Hz. The spectral power of the signal at DC and
above 4 kHz is zero.
This signal is sampled at 8 kHz.
No information is lost—the original spectrum is completely
retained. However, sampling replicates the spectrum periodically
and endlessly, as shown in the figure below.
Sampling Example
NOTE
All sampled signals have frequency spectra that are periodic over the
sampling frequency F
s
.
The original waveform can be restored from any half period of the
spectrum—the other half is just a mirrored image (reversed in
sequence and phase).
Nyquist band = DC ...
F
s
/ 2
The range between DC and the Nyquist frequency F
s
/ 2 is called
the Nyquist band. It contains the relevant spectral information.
Actually, there is no requirement to sample at lowpass conditions.
A signal confined to 8 ... 12 kHz, for example, does not require a
sampling frequency of 24 kHz. It can still be sampled at 8 kHz. The
resultant spectrum would look the same as in the figure above.

 Loading...