28
ENGLISH
4.2.2 Operang Instrucons
Up to 12000 groups of NIBP data can be memorized. Using the Navigaon Knob allows the user to scroll the list up and
down to view NIBP data. When rotang the knob an-clockwise, the list scrolls upward. When rotang knob clockwise,
the list scrolls down. Please note that when the groups of data are less than 6, the Navigaon Knob can not be used to
scroll up or down the lisng.
Pressing “ ” key to return to the Main Screen.
4.3 Screen Display for Graphic Trend
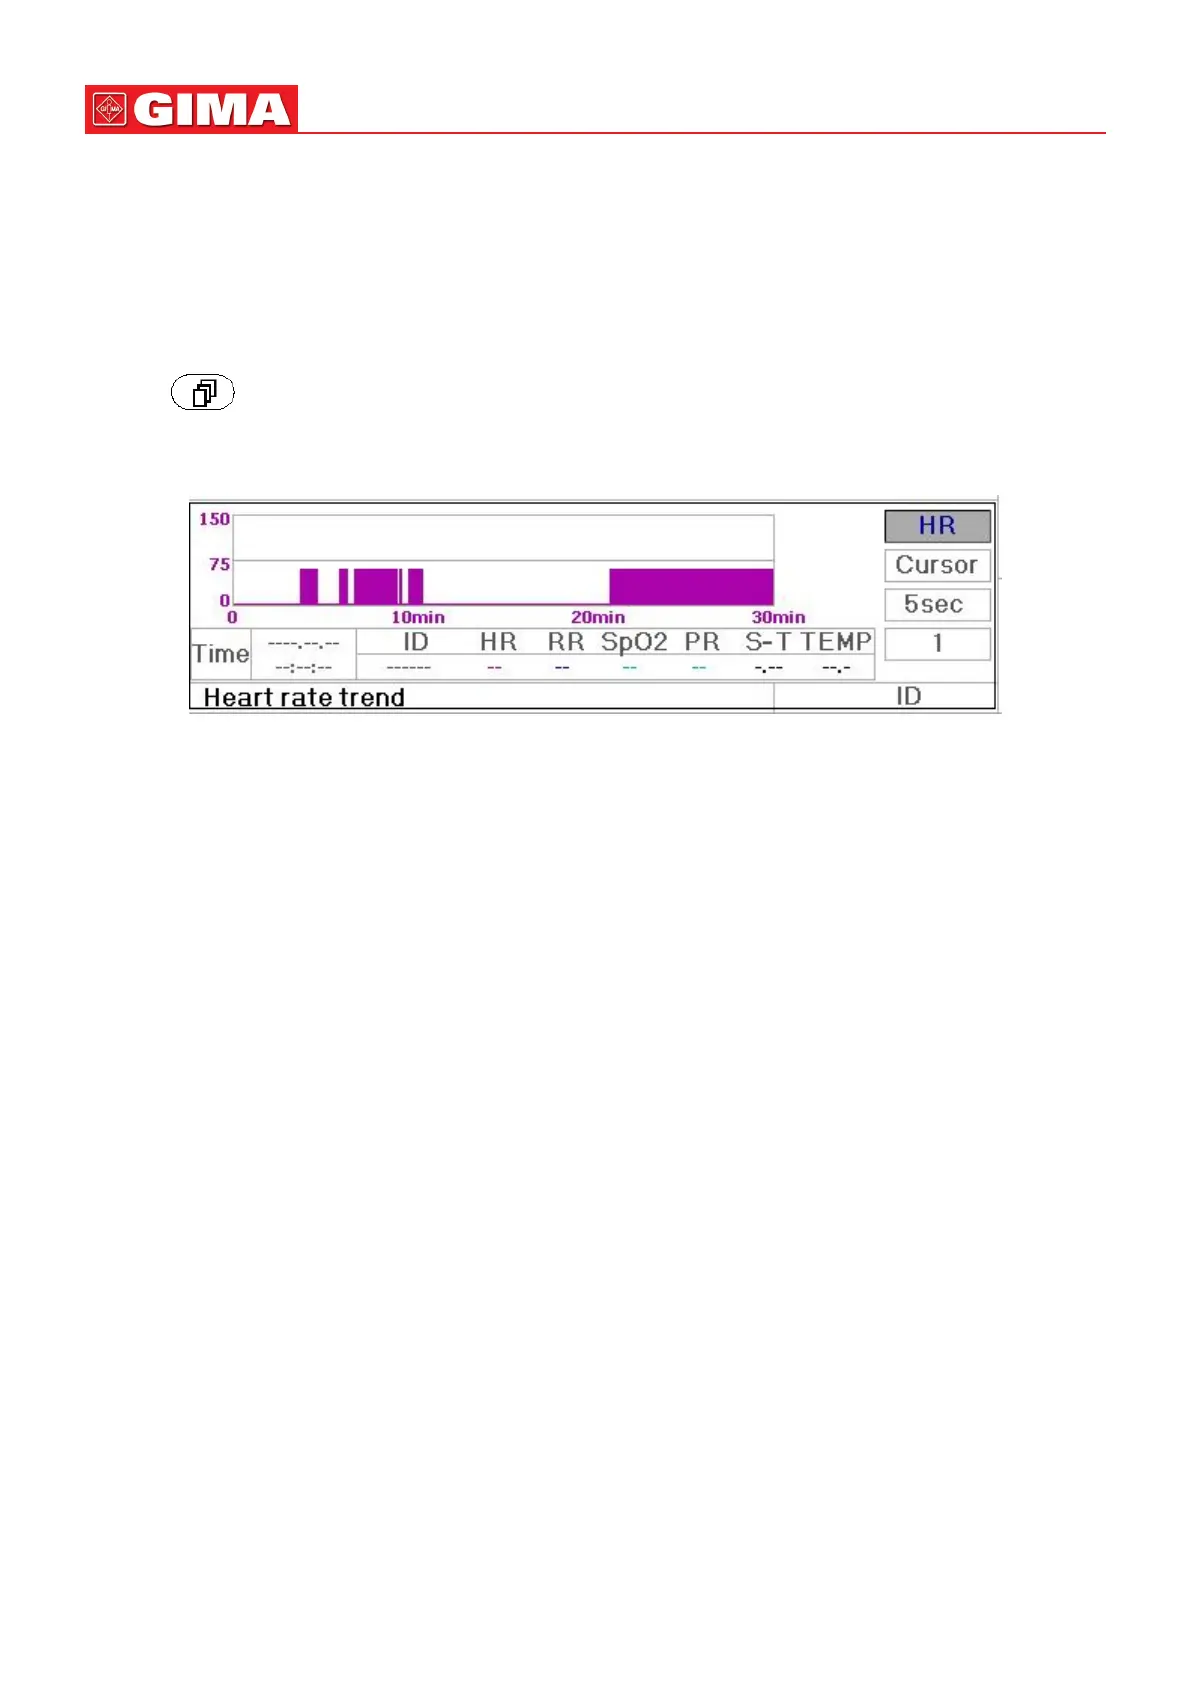
Figure 4.3 HR Trend Graph
4.3.1 How to View the Graphic Trend
Figure 4.3 is the HR trend graph. There are 3 opons on the right of the graph, as described below.
“HR” indicates the current trend graph is HR trend graph. If you want to enter other trend graphs, the procedures are:
move cursor to “HR” and rotate the “Navigaon Knob” to choose the trend graph from “HR”, “S-T”, “Temperature”,
“NIBP”, “PR”, “RR” and “SpO
2
” trend graphs, next press the knob to conrm. Their screens are described in the following
gures.
Aer choosing “Cursor”, the trend graph will display a triangle and a vercal line, a moving ruler mark that can be moved
by rotang the knob. As shown in the gure, when you move the cursor to a specic point, the data area below the graph
will display the mestamp, and its corresponding heart rate, respiraon rate, SpO
2
and temperature. When rotang
“Navigaon Knob” key to move the cursor, the moving step is a variable value depending on the dialing speed. The rule
is that the inial step is 5sec, aer moving it towards the same direcon 1 me, the step becomes 30 sec, and with more
steps the step becomes 1min, 10min and 30min. Therefore, it is very easy to nd the me point you are looking for.
The “5 sec” on the top shows the interval me. Move the focus to the trend me, press the knob and rotate it, and the
trend graph me will change to 30 sec, 1 min, 10 min, 30 min, which changes the horizontal axis to be 30 min, 3 hour, 6
hours, 60 hours, 180 hours. For example, the monitoring can record 360 mes data connuously when seng to “5 sec”
within 30 minutes. Changing the interval me of 30 seconds, it can record 360 mes data within 3 hours. Other changes
are similar to that situaon.
The Trend graph shows parameter value of the current me. For example, in the “5 sec” trend graph, the monitoring
can record the current data with the interval of 5 seconds. Once the monitor is out of power, the data can be stored
automacally and you can scan the history record when turning on the monitor next me. This ensures the screen will
always display the current data connuously. Other trend graph follows the same rule.
Please note that the maximum value on the vercal axis of the HR is 150, not the value of HR upper limit (300). The graph
is scaled down for beer view of the trend curve. When the HR value exceeds 150, the vercal axis’s maximum value will
automacally change to 300. That is to say, the vercal axis value 0-75-150 will change to 0-150-300 automacally if the