27
ENGLISH
Chapter 4 Screen Display
4.1 SpO
2
Trend Data List Screen
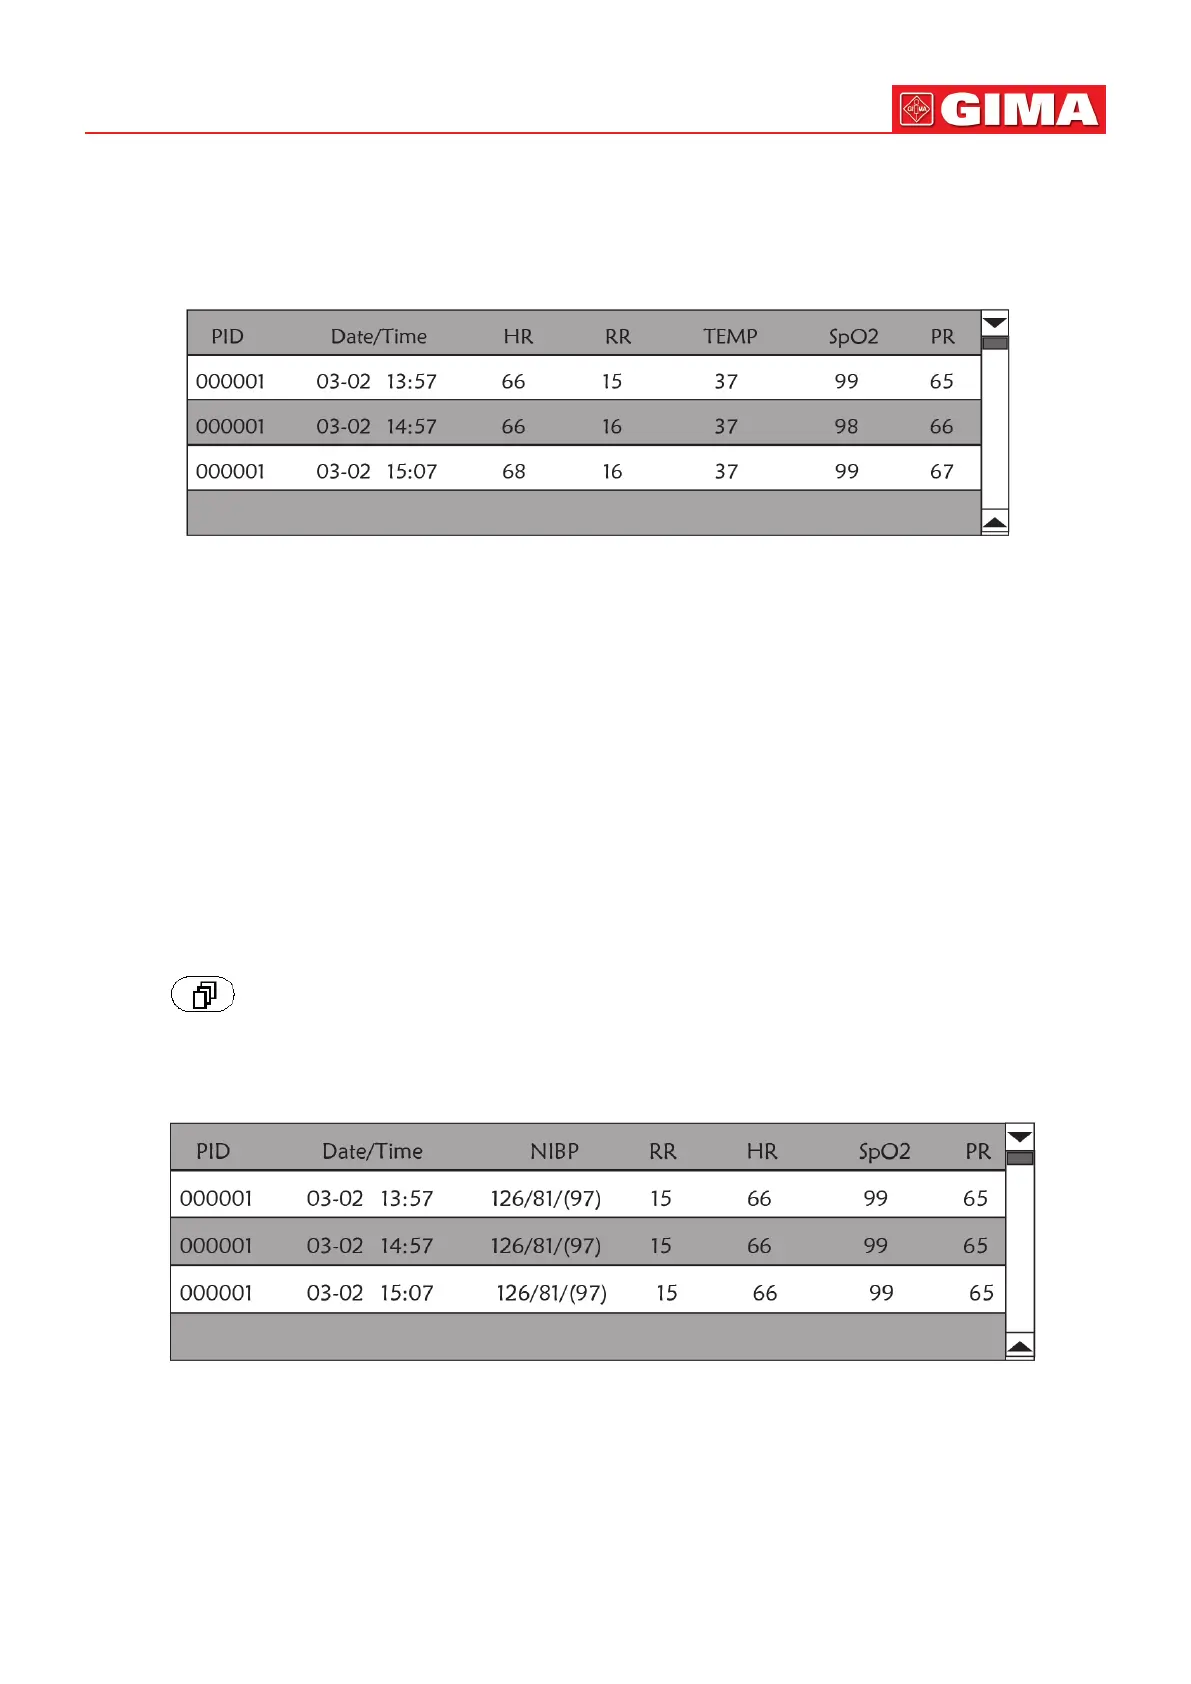
Figure 4.1 SpO
2
Trend Data Lisng Screen
4.1.1 Screen Descripon
When monitoring, the newest data will be displayed on the top of list including “Time, HR, RR, TEMP, SpO
2
, PR”. The me
shows the me when the SpO
2
measurement was taken. Up to 6 groups of SpO
2
data can be displayed on one screen.
There is only one record every 4 seconds.
4.1.2 Operang Instrucons
Up to 400 groups of SpO
2
data can be memorized. Using the Navigaon Knob allows the user to scroll the list up and down
to view SpO
2
data. When rotang the knob an-clockwise, the list scrolls upward. When rotang knob clockwise, the list
scrolls down. Please note that when the groups of data are less than 6, the Navigaon Knob can not be used to scroll up
or down the lisng.
Pressing “ ” key to return to the Main Screen.
4.2 NIBP Data List Screen
Figure 4.2 NIBP Data List screen
4.2.1 Screen Descripon
When monitoring, the newest data will be displayed on the top of list including “Time, NIBP, PR, HR, RR, TEMP”. The me
shows the me when the NIBP measurement was taken. Up to 6 groups of NIBP data can be displayed on one screen.
There is only one record every 4 seconds.