29
ENGLISH
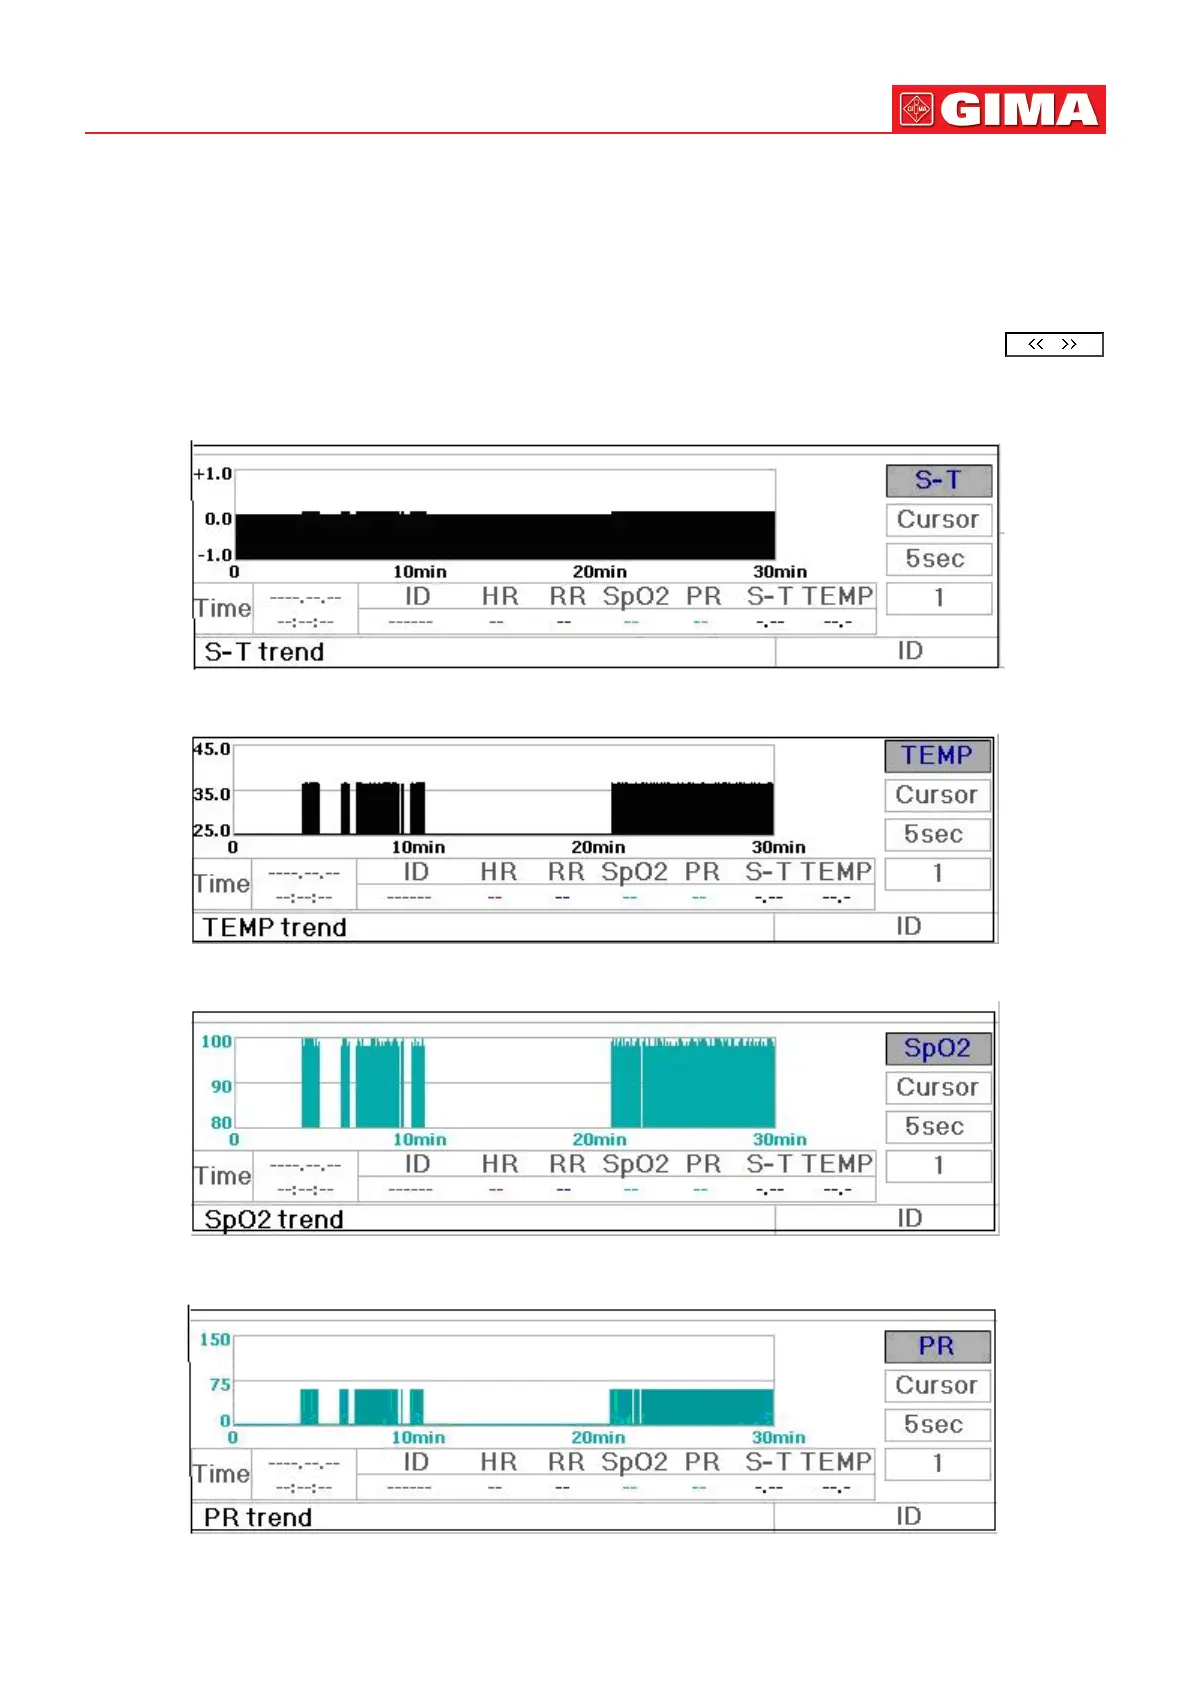
ECG value exceeds 150. When the monitor is reset or the paent ID is changed, the vercal axis will return to its original
value of 0, 75, and 150. Other changes of vercal axis value in other trend graph are similar to that of HR.
The respiraon rate, body temperature and other trend graph are similar to that of HR’s and we will not cover them
in detail again. Please note that for NIBP trend graphs, the horizontal axis is the sequence number of mes the blood
pressure measurement instead of mestamp.
NIBP graphic trend is a lile dierent from the other graphic trends. Rotate the knob to move the cursor to “
”, then press the knob for acvang this item. Next, rotate the knob towards le or right for viewing another 400 groups’
graphic trend.
Figure 4.4 S-T Segment Trend Graph
Figure 4.5 Body Temperature Trend Graph
Figure 4.7 SpO
2
Trend graph
Figure 4.8 PR Trend Graph