SMART
H000002007-RDS User Manual │Version 5.0.0 (2018-09-17) │151
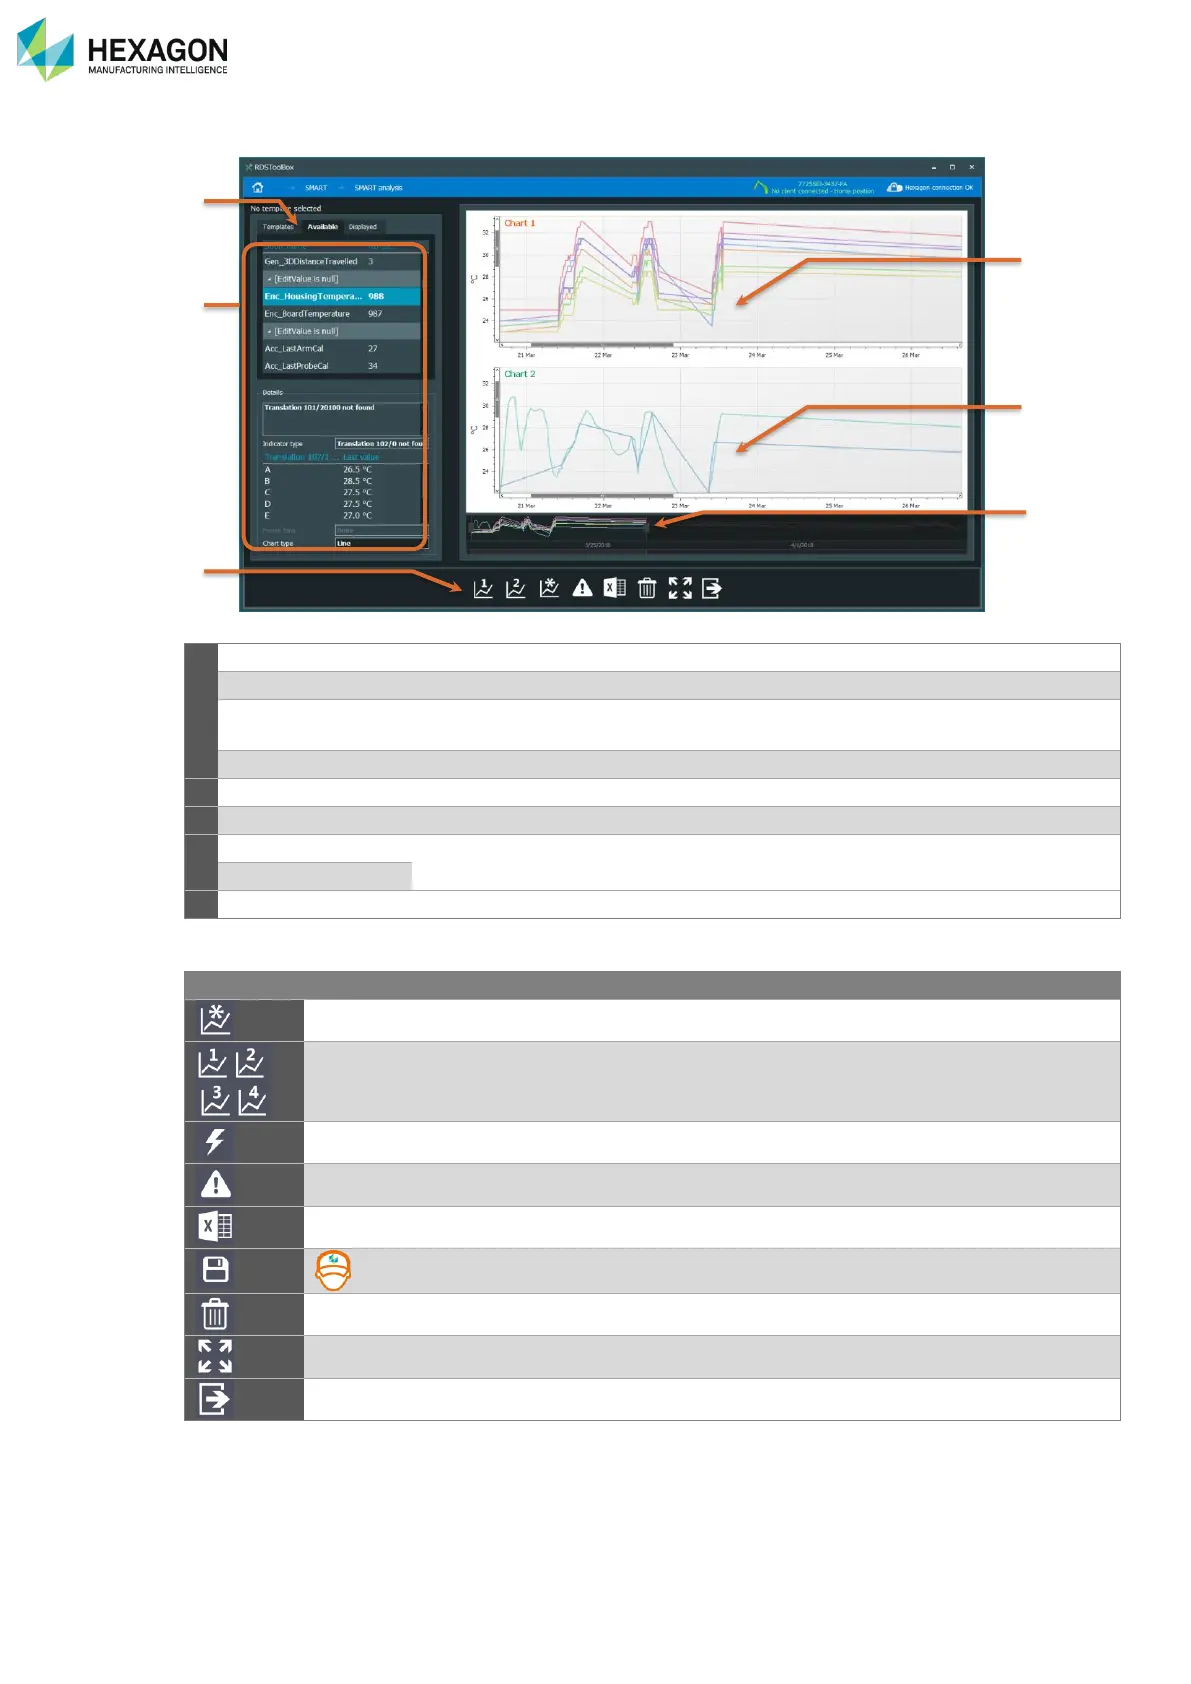
J.6.1 DESCRIPTION OF THE PANEL
Displays the saved templates to use them
Displays the list of all the available indicators and details to add the chart
manually
Shows the current indicators used in a chart
… Up to 4 charts can be displayed
Graphic control of the time range
Adds the current indicators selection on a new chart (up to 4 charts)
Adds the current indicators selection on the existing chart Nb1 / 2 / 3 or 4
Displays all the alerts on the charts
Displays all the events on the impacted chart
Exports the values of each graph into a separate excel file
Saves the current workspace as a new template
Removes all the charts and clear all the workspace
Refits the charts to the entire time range
Closes the panel and goes back to SMART Overview panel