SMART
H000002007-RDS User Manual │Version 5.0.0 (2018-09-17) │156
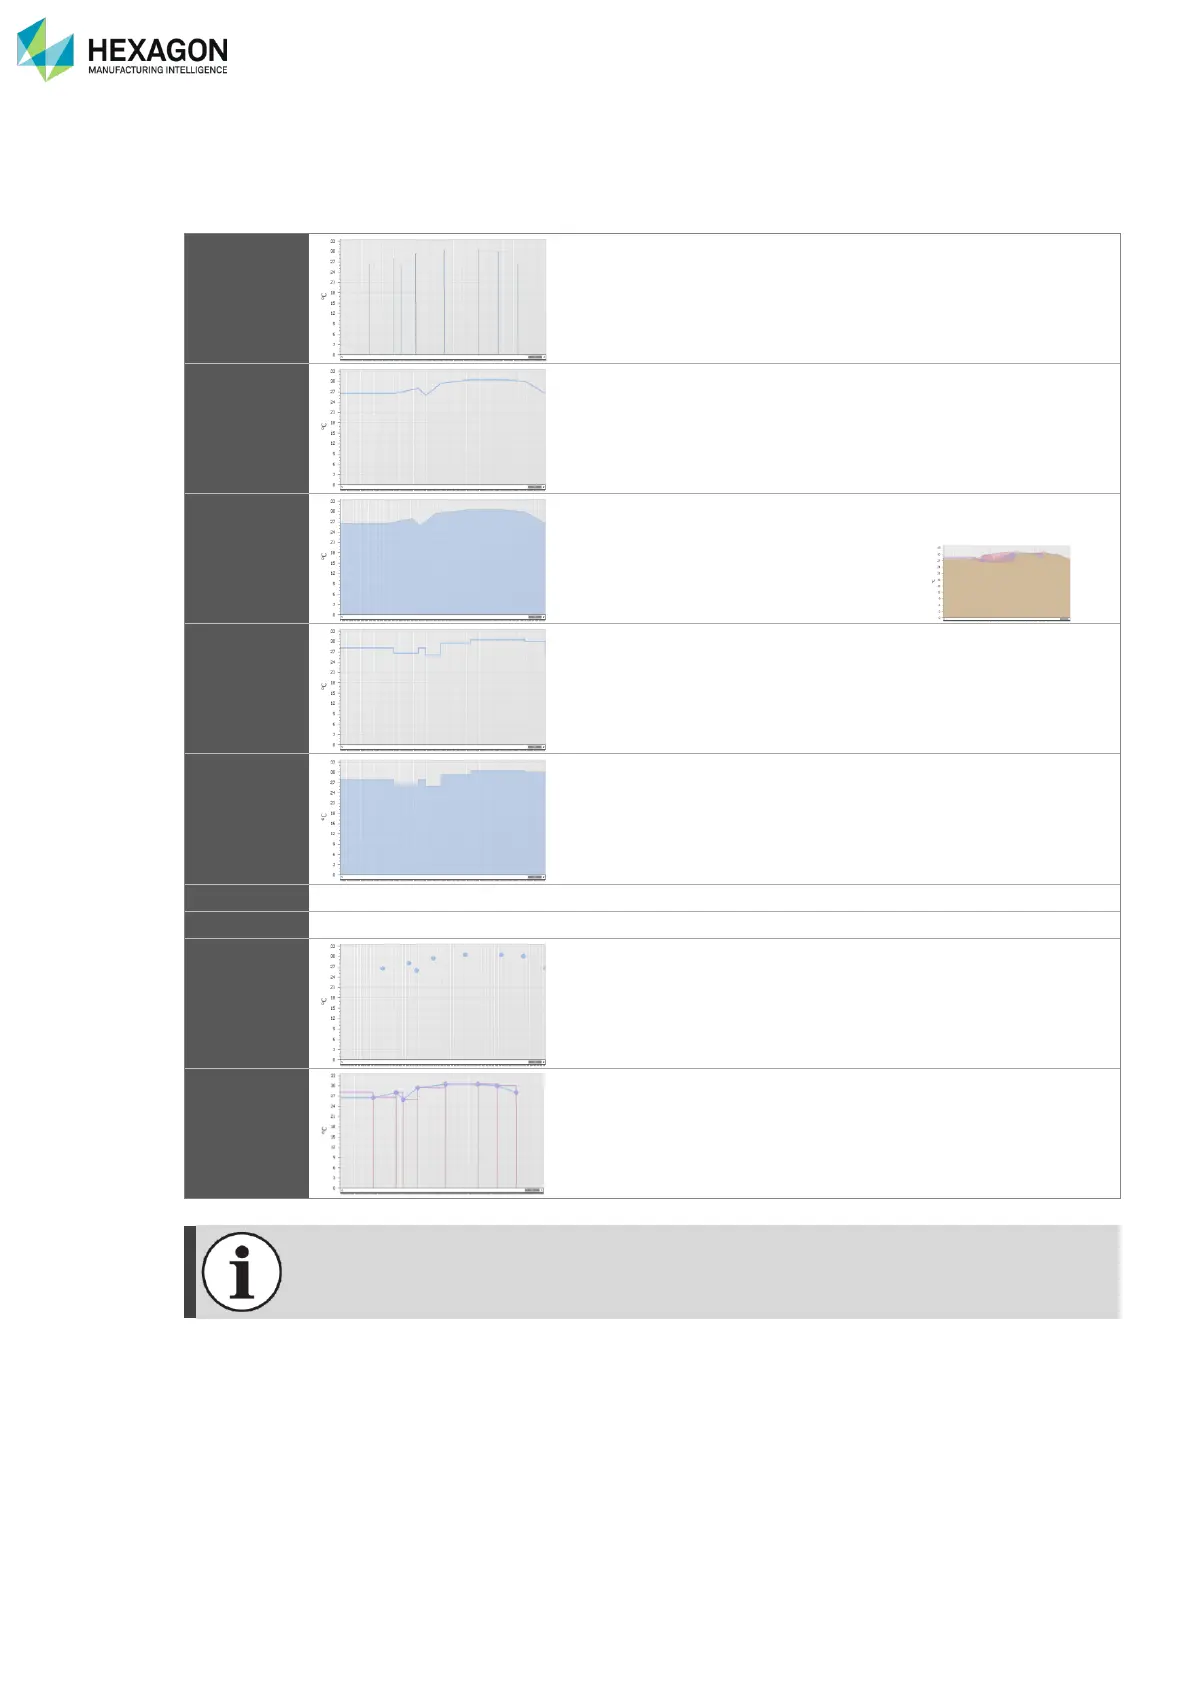
J.6.5 TYPE OF CHARTS
Different kinds of graphs can be chosen: all are based on the points of the indicators; the difference is
located on the way to link them.
Pikes are displayed only on the points of the graph.
This is useful for indicators to show abnormal occurrence
such as shocks.
All the points are linked by a straight segment.
This is the typical way to represent immediate values
(temperatures for example).
Area is based on the Line chart, but all the area under the line
is filled.
It is useful to better see the graph, but
not recommended for multiple lines on
same graph.
All the points are linked through steps.
This is more convenient for counters and time counters.
As for Area based on Line, Step area is based on Step line,
and the field under the steps is filled.
Here again the purpose is to better see the graph, but it is not
advised for multiple steps on same graph.
Point chart is the basic mode, the points are simply displayed
as dots and not linked.
Several types can be displayed on the same graph by adding
them one by one on an existing graph
The Range graph is always displayed as “Line”.