SMART
H000002007-RDS User Manual │Version 5.0.0 (2018-09-17) │154
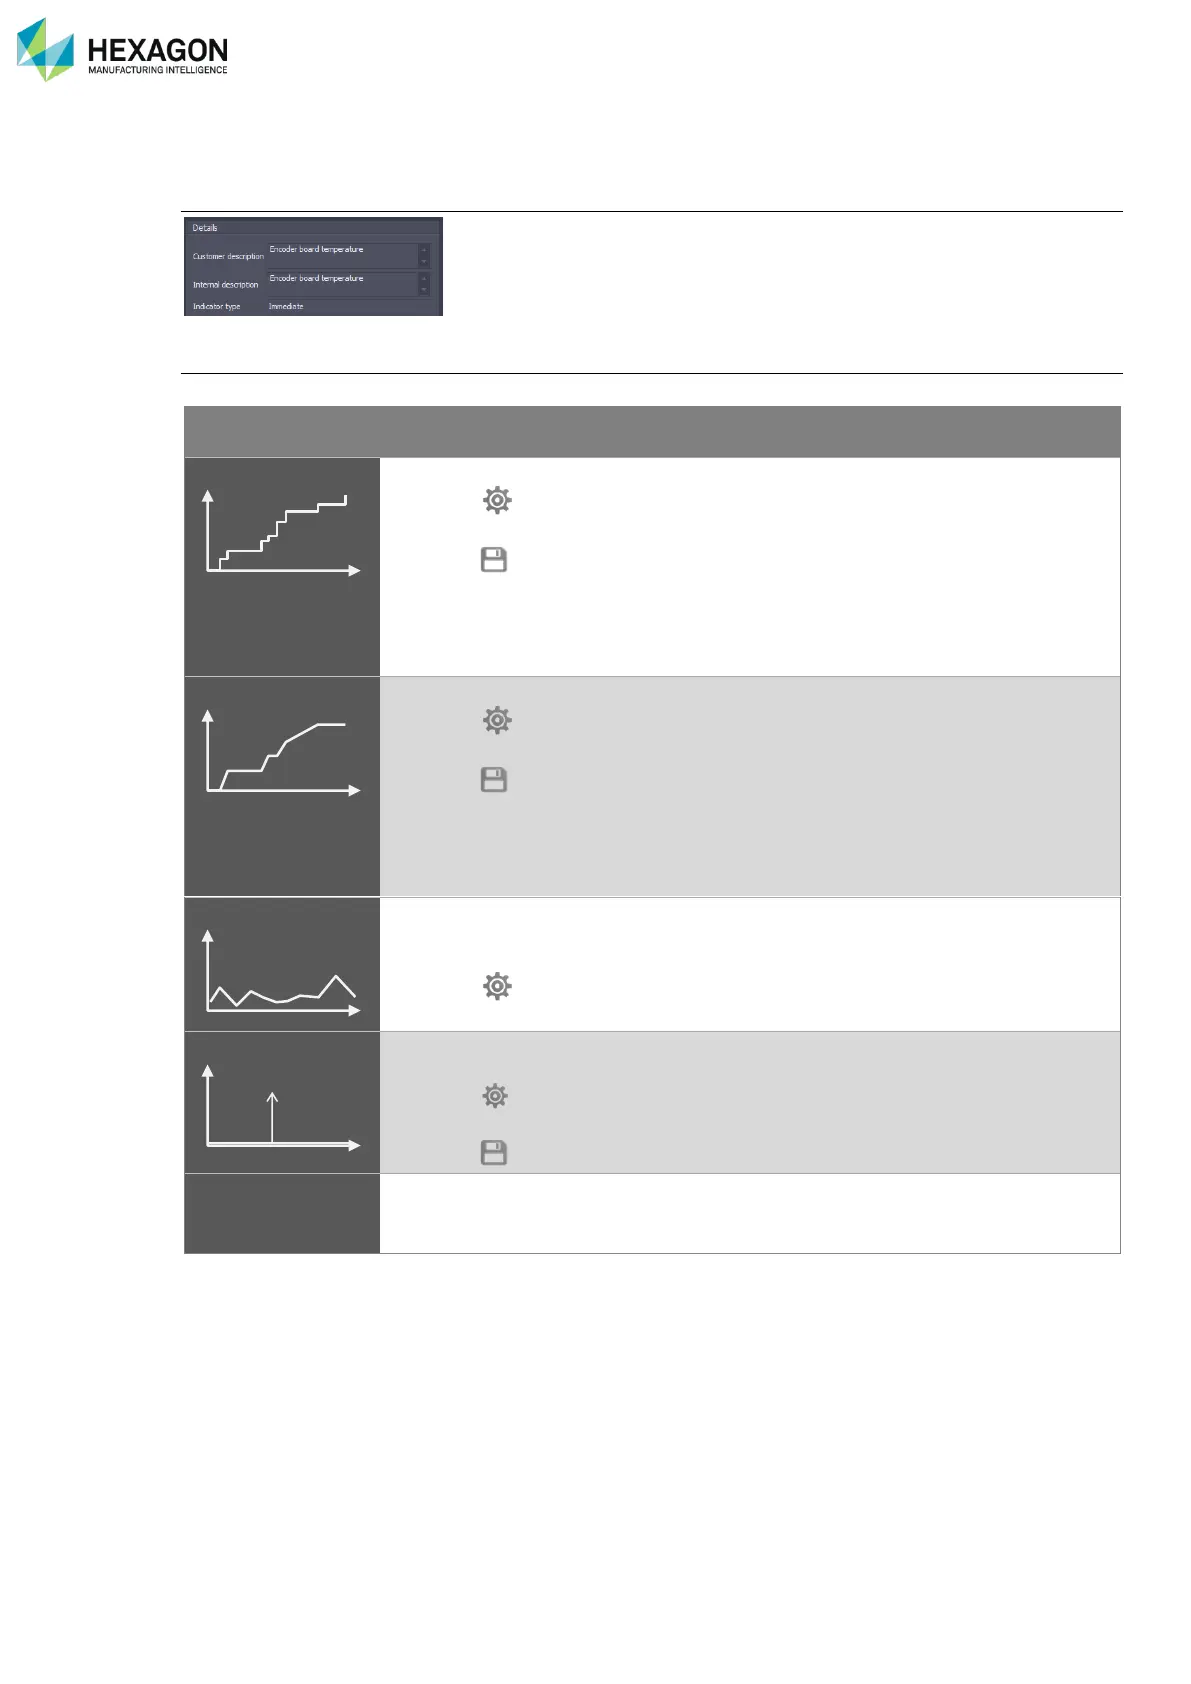
J.6.4 DETAILS OF AN INDICATOR
The details zone gives descriptions about the selected indicator.
Descriptions
Type of indicator
Several types of indicators may be found
A counter evaluates a number of occurrences or a distance.
A counter is increased only each time the SMART sensor is
actuated.
The name usually ends by “Count”
The last value (details zone) represents the overall total.
The chart can represent sub totals per hour, per day per month.
The chart may also represent the overall total evolution (Period time =
“None”)
A Time counter evaluates duration.
A Time counter is increased in real time as soon as the SMART
sensor is active.
The name usually ends by “Time”
The last value (details zone) represents the overall total.
The chart can represent sub totals per hour, per day per month.
The chart may also represent the overall total evolution (Period time =
“None”)
An immediate indicator evaluates an instant value that can be measured
at any moment: a temperature, a size, a voltage, a value (Alignment
result), a percentage (of loading) …
An immediate value is automatically periodically measured by the
SMART sensors.
An event memorizes specific unexpected or abnormal occurrences
(shocks…)
An event is memorized only when the occurrence occurs, when one
sensor exceeds a limit.
The name usually ends by “Event”