SMART
H000002007-RDS User Manual │Version 5.0.0 (2018-09-17) │165
J.7.2 HOW TO ADD AN INDICATOR DIAGRAM TO A GRAPH
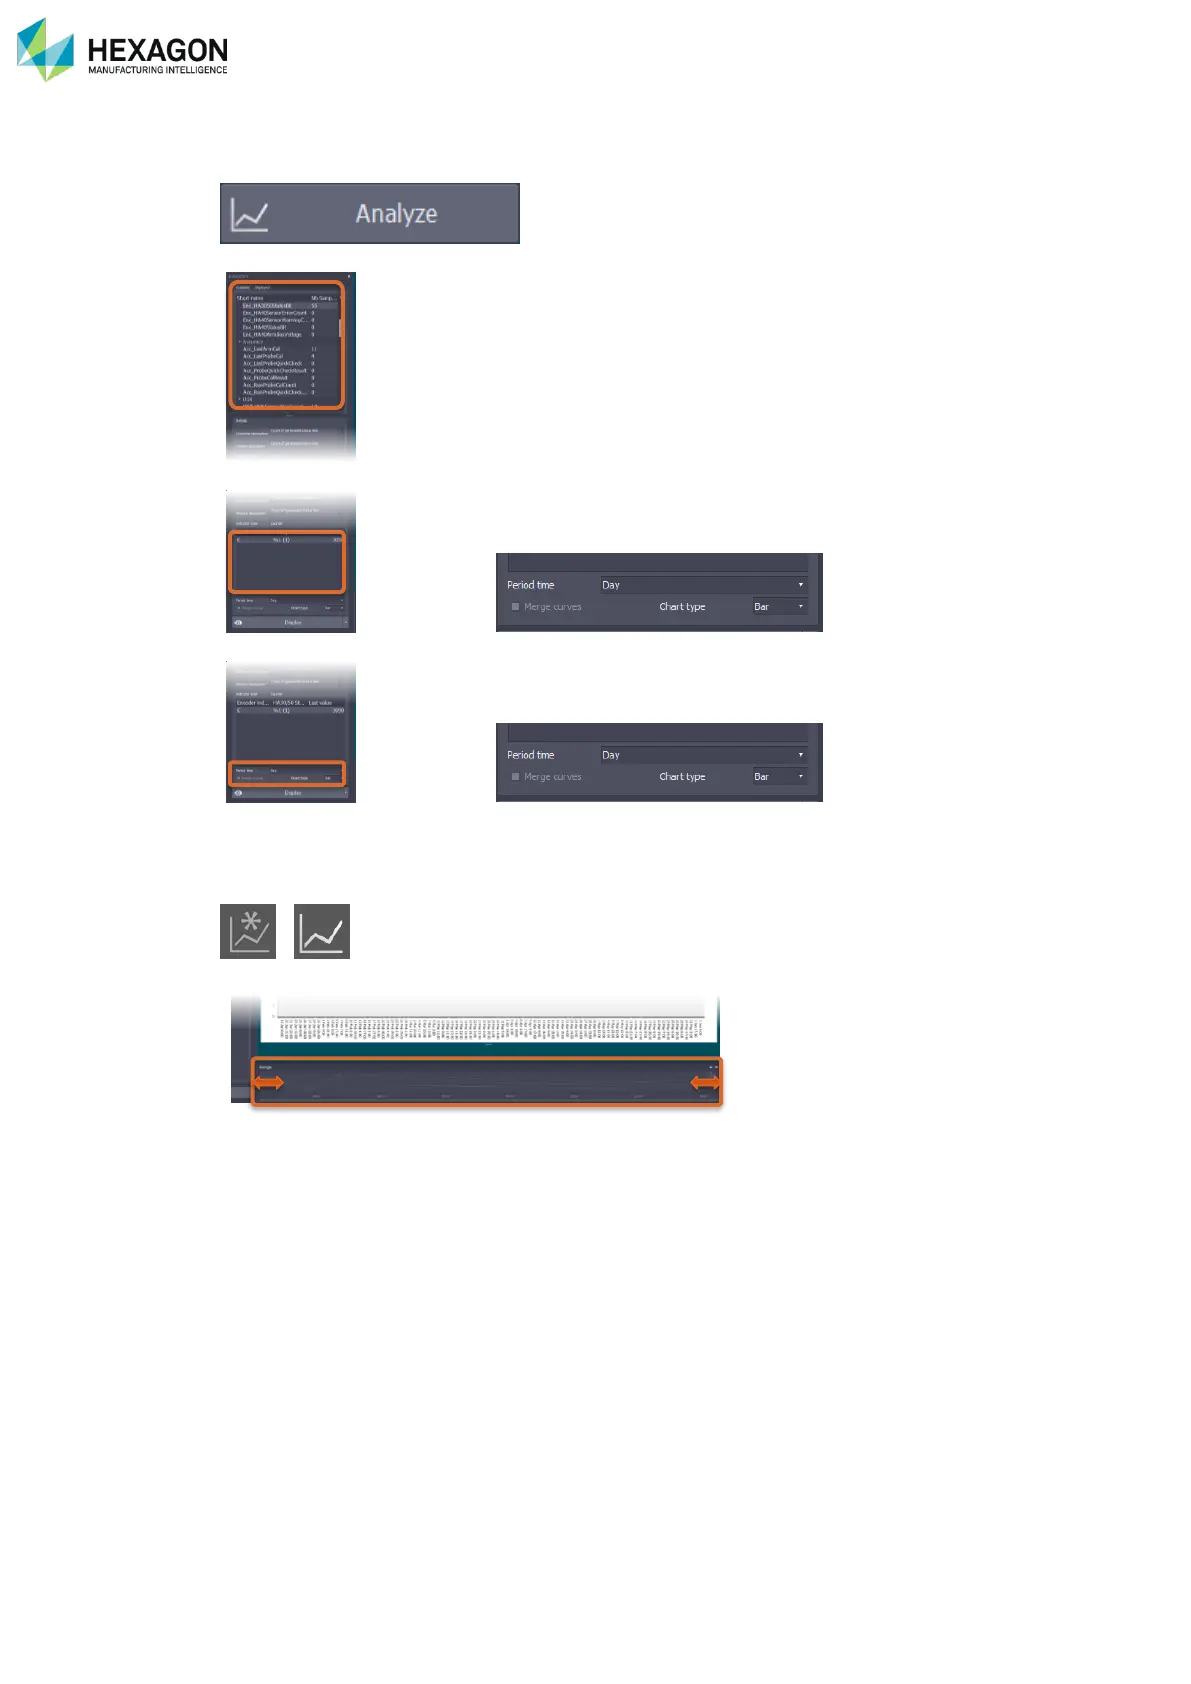
1. Access the SMART analysis panel.
2. In the list of available indicators, select the wanted item.
3. In details zone, select the index(es) of the selected indicator (encoder index, probe index, …):
4. In details zone, select the type of graph:
Period time (None / Hour / Day / Month)
Chart type (Bar / Area / Line / Step line / Step area / Spline / Spline area / Point)
5. Click on a graph button to choose to add on a new graph or an existing one
/
6. On the Control of the time range, scroll the left and right sides to define the start and end time