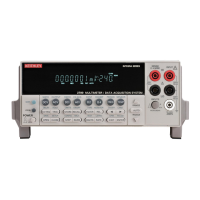
6-8 Buffer Model 2700 Multimeter/Switch System User’s Manual
Buffer statistics
Minimum and maximum
This mode displays the minimum and maximum readings stored in the buffer. The buffer
location number and timestamp are also provided for these readings.
Peak-to-peak
This mode displays the peak-to-peak reading (peak-to-peak = Maximum - Minimum).
Average
The average mode displays the mean (average) of all measured readings stored in the
buffer. The following equation is used to calculate mean:
where: y is the average.
X
i
is a stored reading.
n is the number of stored readings.
Standard deviation
This mode displays the standard deviation of buffered readings. The following equation is
used to calculate standard deviation:
where: y is the standard deviation.
X
i
is a stored reading.
n is the number of stored readings.
NOTE If the standard deviation calculation is being performed on a buffer that has
more than 1000 readings, the “CALCULATING” message will flash to indicate
that the Model 2700 is busy. While busy with the calculation, front panel keys
will not operate.
y
X
i
i1=
n
∑
n
---------------=
y
X
i
2
in1–=
n
∑
1
n
---
X
i
i1=
n
∑
⎝⎠
⎜⎟
⎜⎟
⎛⎞
2
⎝⎠
⎜⎟
⎜⎟
⎛⎞
–
n1–
---------------------------------------------------------------=

 Loading...