8. Maintenance and Inspection
8-15
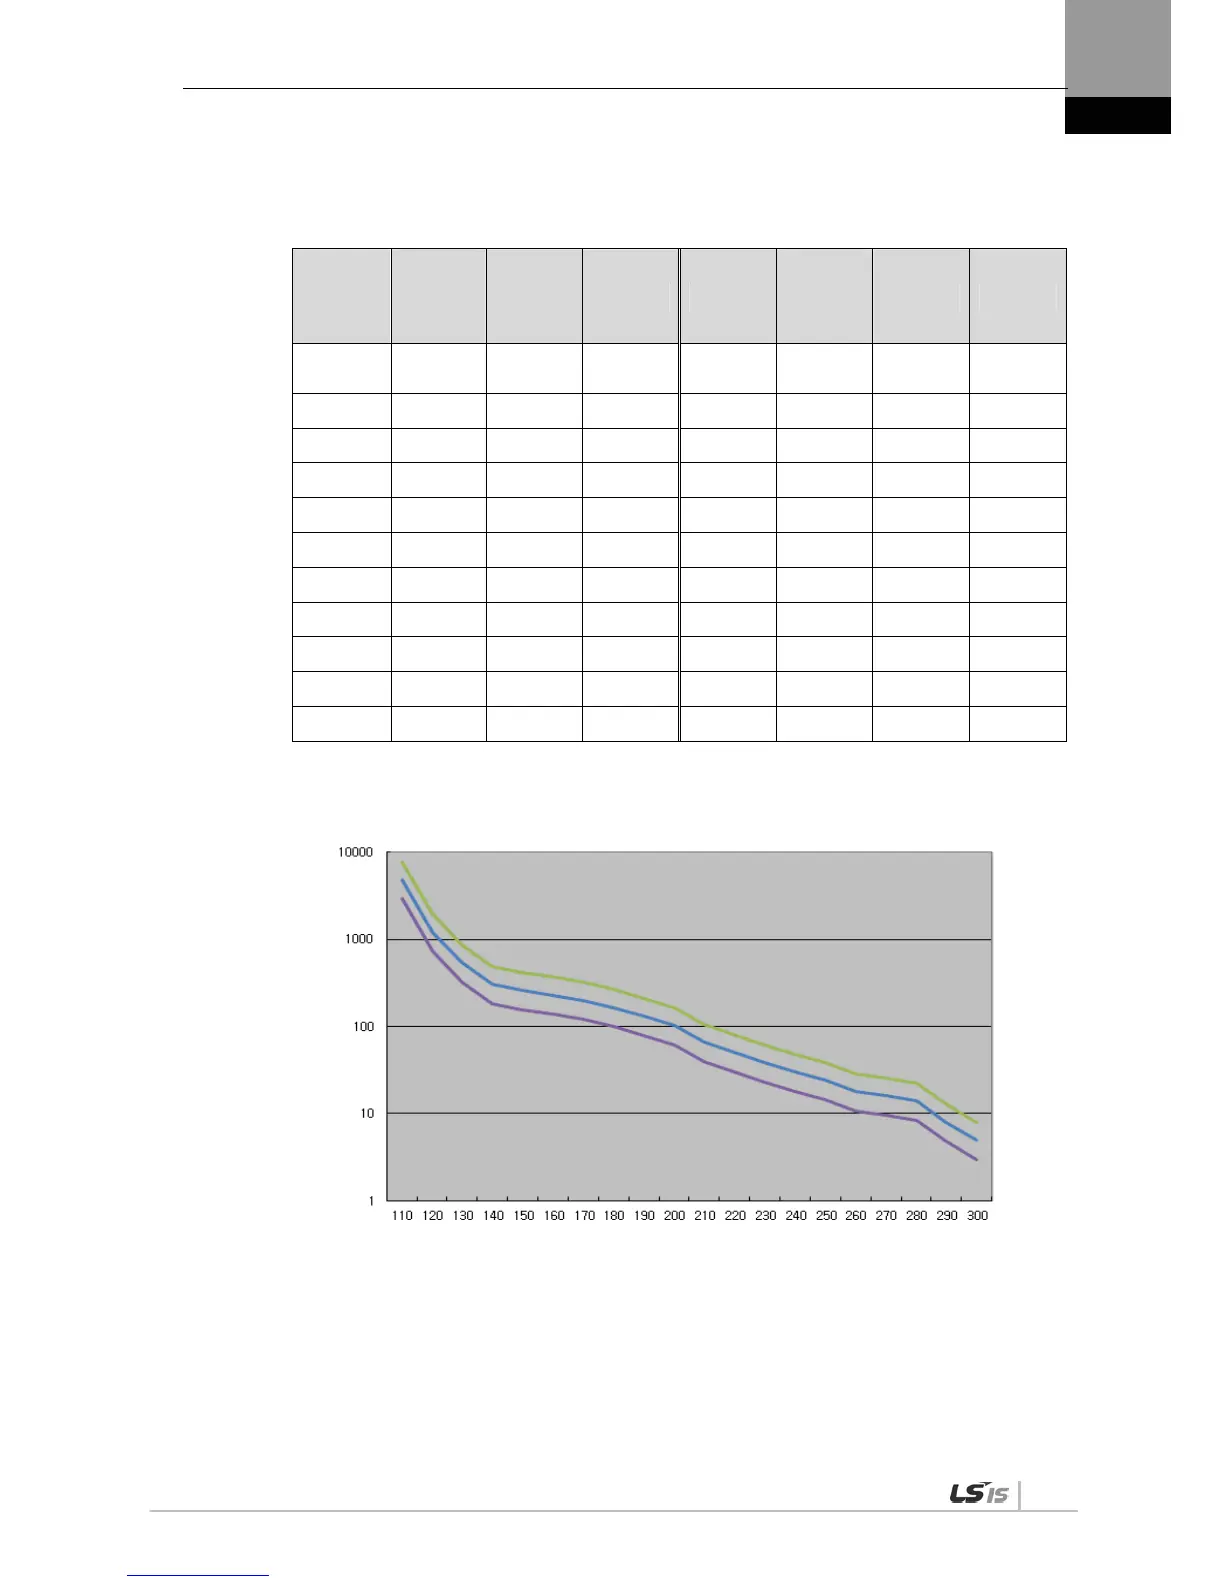
Servo Drive Overload Graphs (5.0KW)
(1) Graph of Overload during Rotation
Load(%)
AL-21
Occurri
ng Time
(sec)
MAX MIN
100% or
below
Infinite
110 4832.0 7731.2 2899.2 210 66.8 106.9 40.08
120 1208.0 1932.8 724.8 220 50.1 80.2 30.06
130 536.9 859.0 322.1333 230 38.5 61.6 23.1
140 302.0 483.2 181.2 240 30.3 48.5 18.18
150 257.0 411.2 154.2 250 24.2 38.7 14.52
160 229.0 366.4 137.4 260 18.0 28.8 10.8
170 200.0 320.0 120 270 16.0 25.6 9.6
180 165.0 264.0 99 280 14.0 22.4 8.4
190 131.0 209.6 78.6 290 8.0 12.8 4.8
200 103.0 164.8 61.8 300 5.0 8.0 3.0
Load Curve During Stop
Time (sec)
Load Factor (%)
 Loading...