Milestone Srl MA245-001 – ultraWAVE 3 – User Manual
94
It is possible to open the reactor from the System page. See the system page chapter for more
details
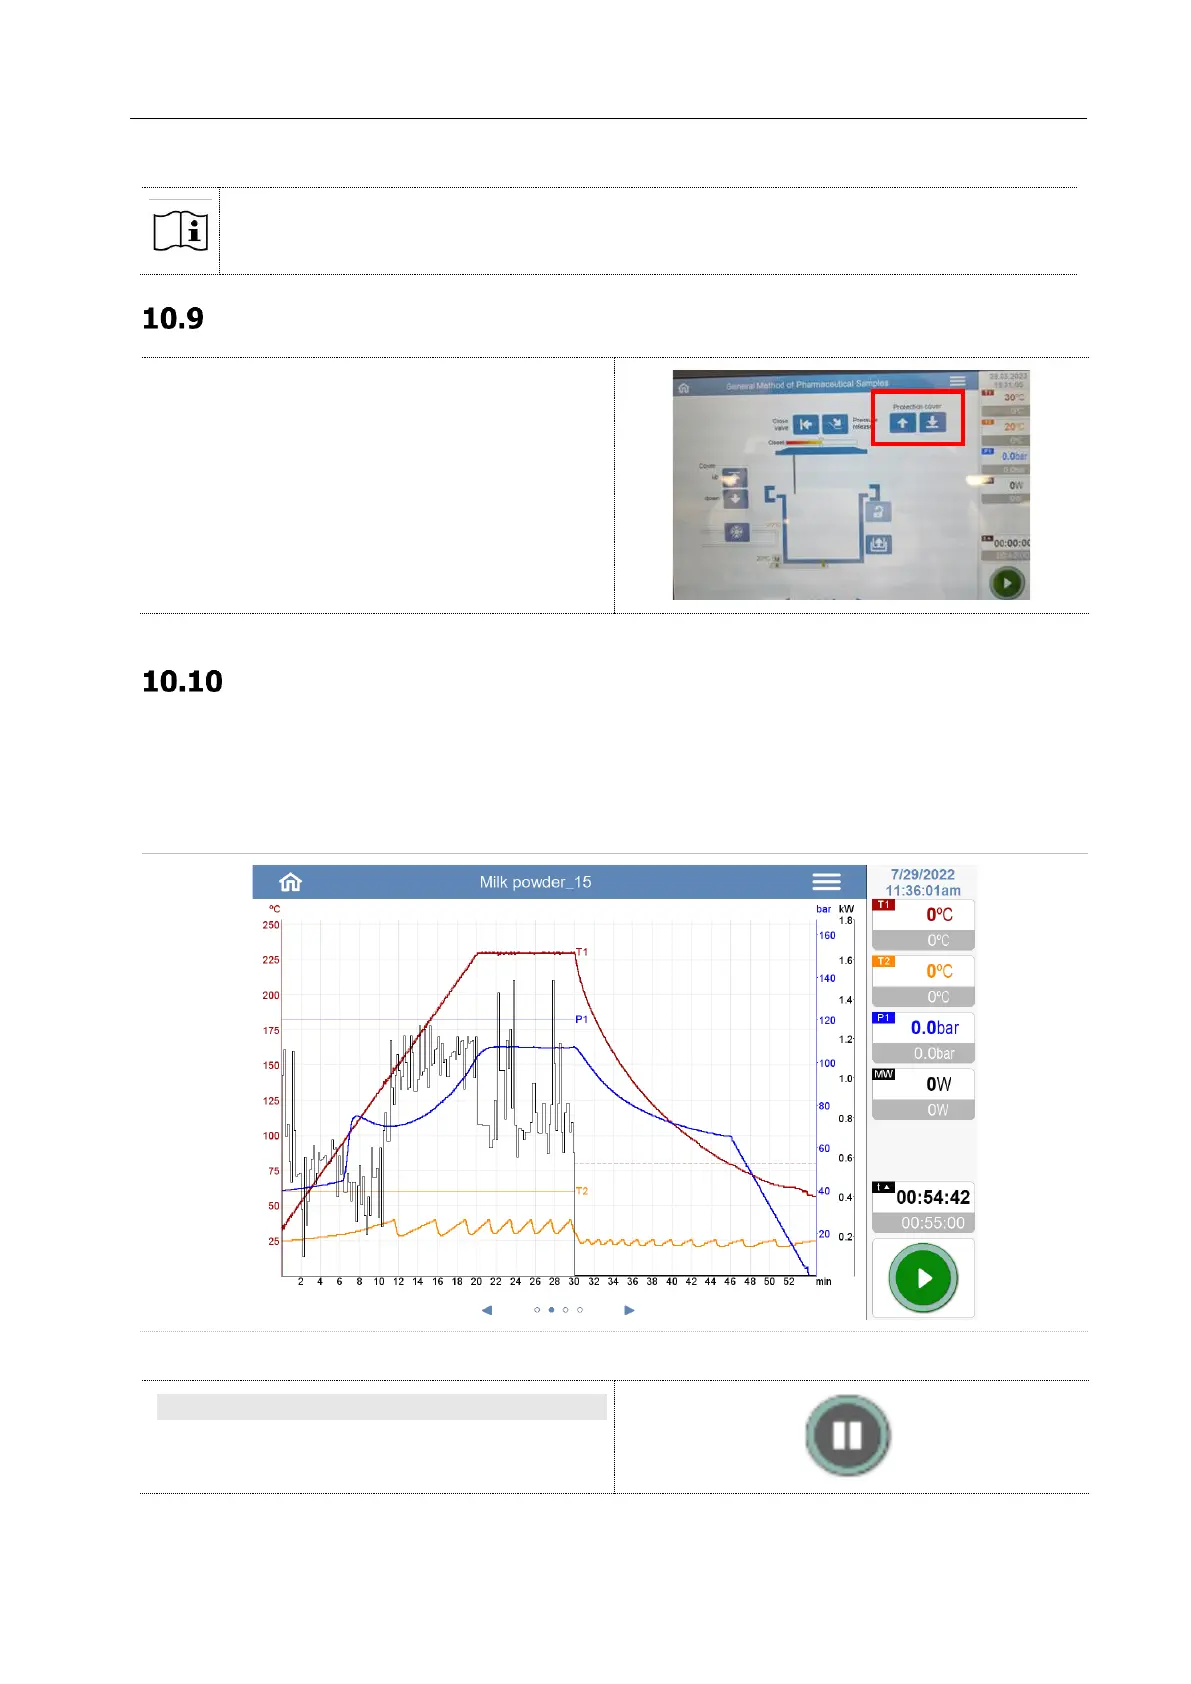
To open and close the front protection panel,
press the arrow icons on the System page
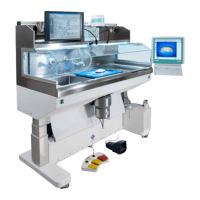
Program sequence
During the MW-cycle, the software records all data of control parameters. The gradients of temperature,
pressure and power are displayed graphically in real time on graph.
The recorded curves of temperature or pressure appear in darker of the given curves.
After the program, the graph (run file) can be printed or saved on the USB pen.
PAUSE
While the program is running, the pause icon
appears to the right.