Measurements and Result Displays
R&S
®
FSPN
96User Manual 1179.4363.02 ─ 01
Remote command:
Trace data: TRACe<n>[:DATA]? on page 333
Y-axis scale: Chapter 11.6.9.1, "Frequency Configuration", on page 386
Frequency Deviation
The "Frequency Deviation" result display shows the frequency deviation of the transi-
ent response of the DUT from an ideal linear behavior over time.
The x-axis shows the time period over which the signal has been measured. The scale
depends on the defined start and stop time.
The y-axis shows the deviation of the signal from the reference line within the time-
frame between start and stop time. The scale of the y-axis depends on your configura-
tion.
The frequency deviation calculation settings are described in Chapter 6.9.7, "Fre-
quency Deviation", on page 140.
Remote command:
Trace data: TRACe<n>[:DATA]? on page 333
Phase
The "Phase" result display shows the phase characteristics of the transient response of
the DUT over time.
The x-axis shows the time period over which the signal has been measured. The scale
depends on the measurement time.
The y-axis shows the phase. The scale of the y-axis depends on your configuration.
Remote command:
Trace data: TRACe<n>[:DATA]? on page 333
Y-axis scale: Chapter 11.6.9.5, "Y-Axis Scale", on page 394
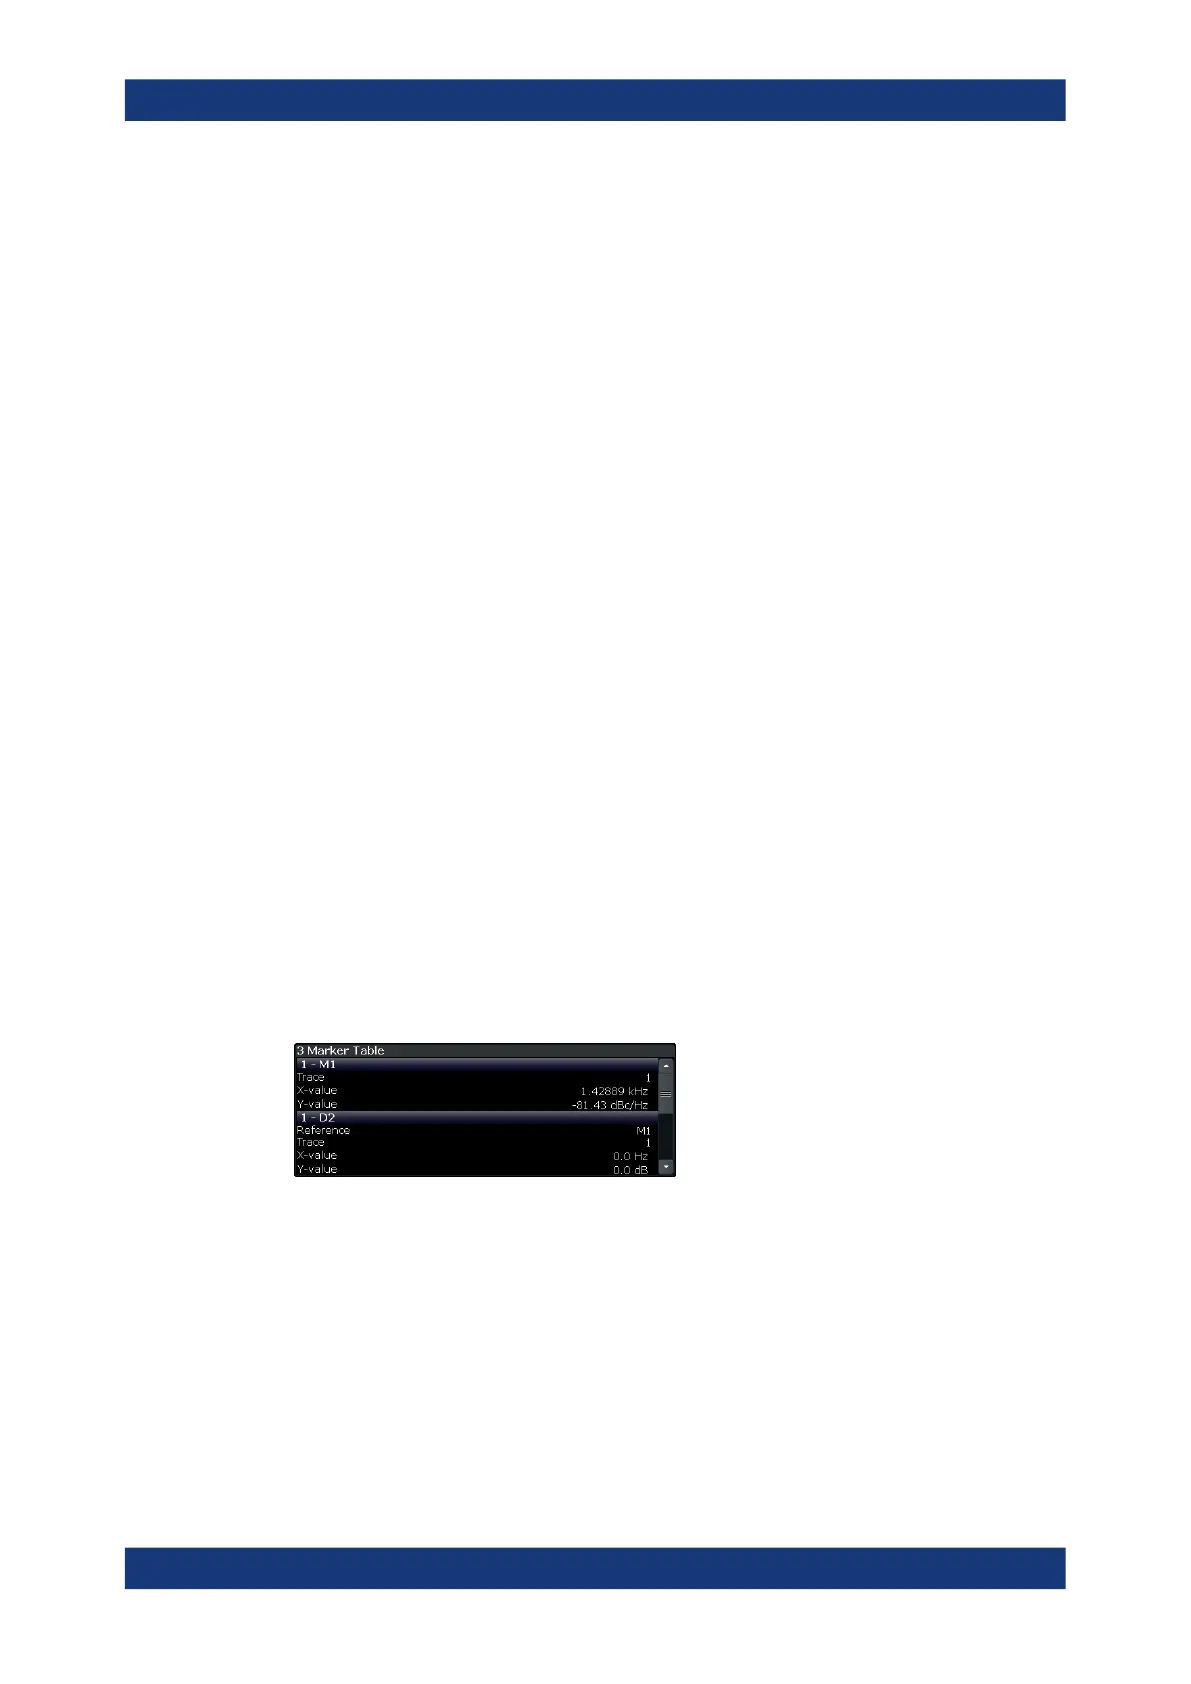
Marker Table
Displays a table with the current marker values for the active markers.
This table is displayed automatically if configured accordingly.
Remote command:
LAY:ADD? '1',RIGH, MTAB, see LAYout:ADD[:WINDow]? on page 404
Results:
CALCulate<n>:MARKer<m>:X on page 430
Result Displays