Roche Diagnostics
Operator’s Manual · Version 3.0 75
Multiplate® analyzer 4 Software
Main screen
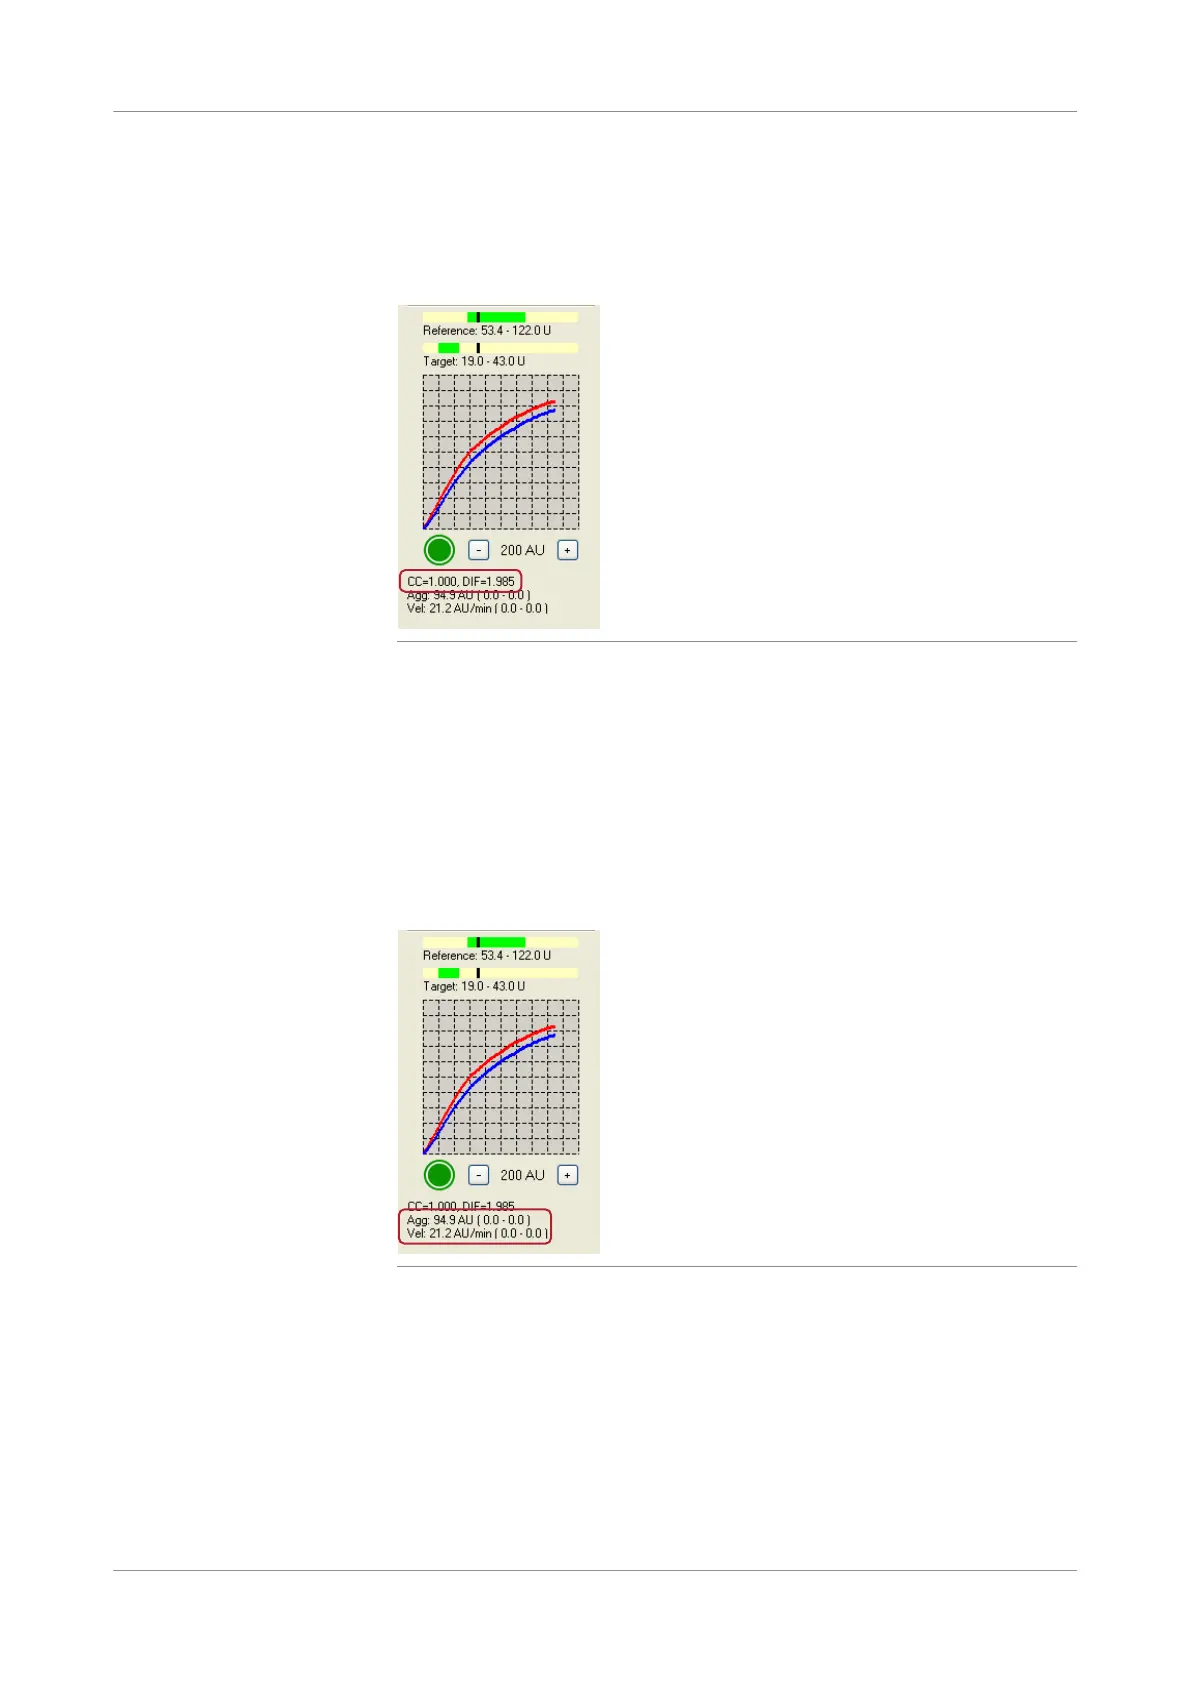
Quality control parameters This line displays the aggregation curve QC (internal control) parameters correlation
coefficient (CC) and deviation from mean (DIF). This represents the correlation of
the two measurements performed in each test cell.
u See Data alarms (p. 141).
Figure 4-7 Parameter display
The CC is calculated using the Pearson algorithm with data recorded during
measurement by each individual sensor in each test cell. Deviation of the two single
measurements from the mean is displayed in percent.
Aggregation and velocity Aggregation is the increase of impedance during the analysis. Velocity is the maximal
slope of aggregation. The AUC is the recommended parameter for result reporting.
The display of aggregation and velocity can be enabled for each test in Configuration
> Edit tests using the functions Show reference range for Ag and Show reference
range for vel..
Figure 4-8 Parameter display