196
Accessing Diagnostic values
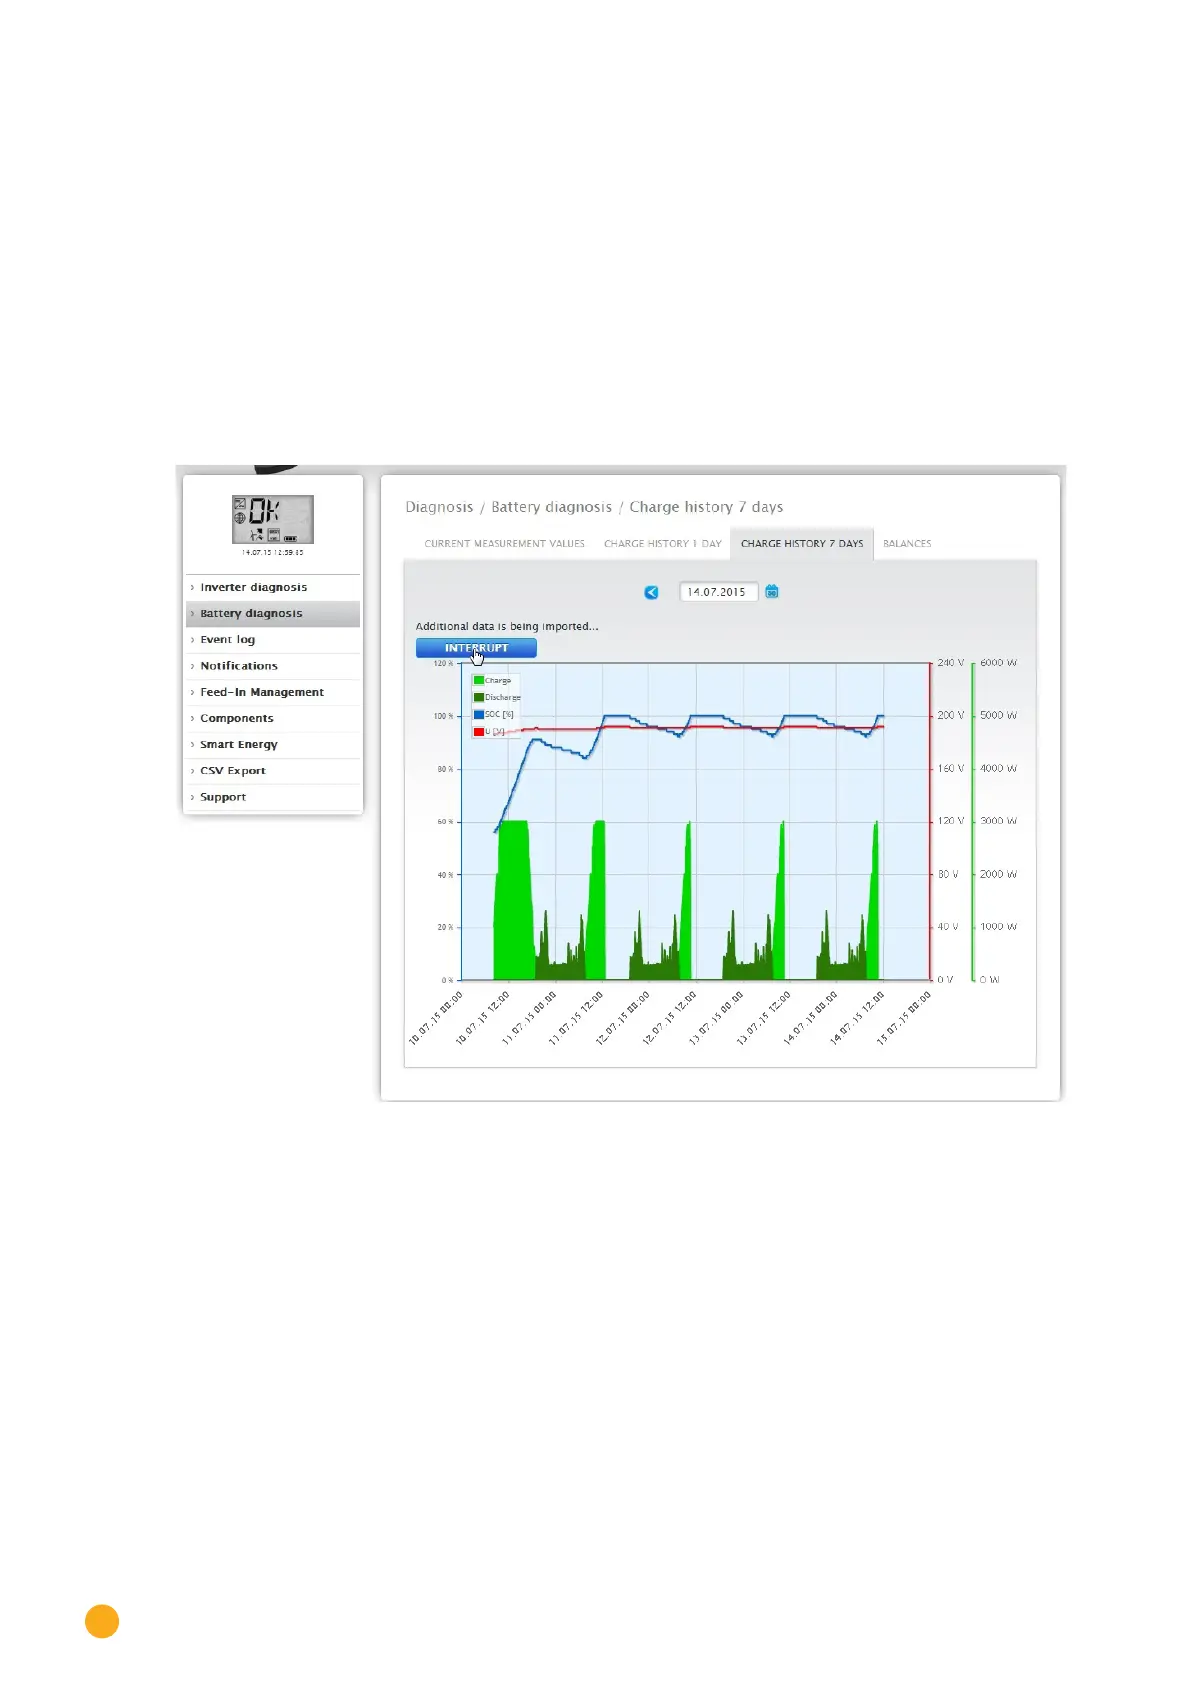
17.2.3 Charging History 7-Days
A graph containing the last seven days with the following values is in the Charging History 7-Days tab.
•
Charge
The battery’s charge levels from the last 7 days in watts.
•
Discharge
The battery’s discharge levels from the last 7 days in watts.
•
Charge Level (%)
The battery’s charge levels from the last 7 days as a percentage.
•
U (V)
The battery’s voltage curve over the last 7 days.
Fig.: Battery diagnostic - Charging History 7-Days
The
Date box offers the option to select a particular 7-day period for viewing. The arrow keys can also be
used to move to the next or previous date.
The individual values, at the top-left of the graph key, can be displayed or hidden with a mouse click.
If needed, click on the
interrupt button to stop loading the data.