242
Accessing Yield Data
•
Yellow areas - Production
•
Red areas - Consumption (Total = not covered by production (red in the graph) + covered by pro-
duction (green in the graph).
•
Green area - self-consumption (covered by production - green in the graph) with a percentage (in
relation to production).
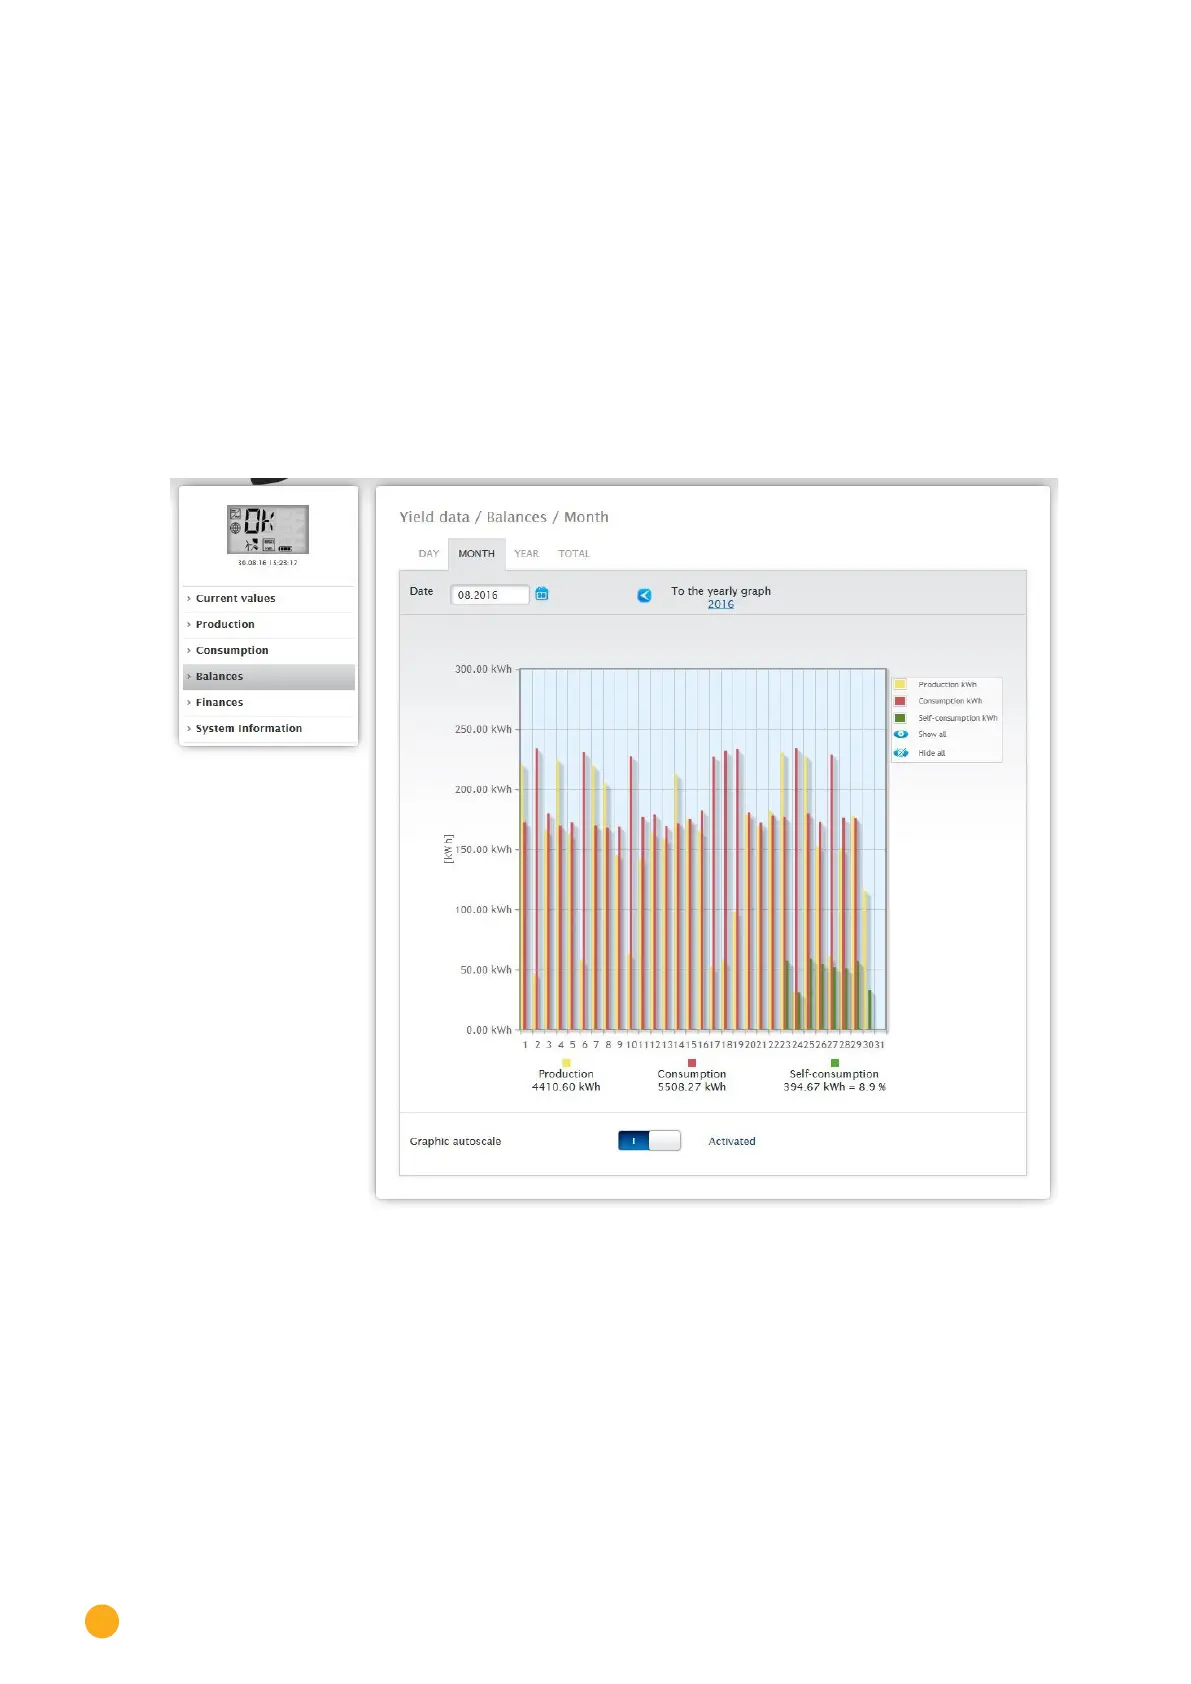
18.4.2 Month balance
The Month tab under balances displays the production and consumption side-by-side in a bar graph.
•
Move the mouse above one of the bars to view either the daily yield or consumption.
•
Click on one of the bars to go to the corresponding day view.
Fig.: Month view balance graph