227
Accessing Yield Data
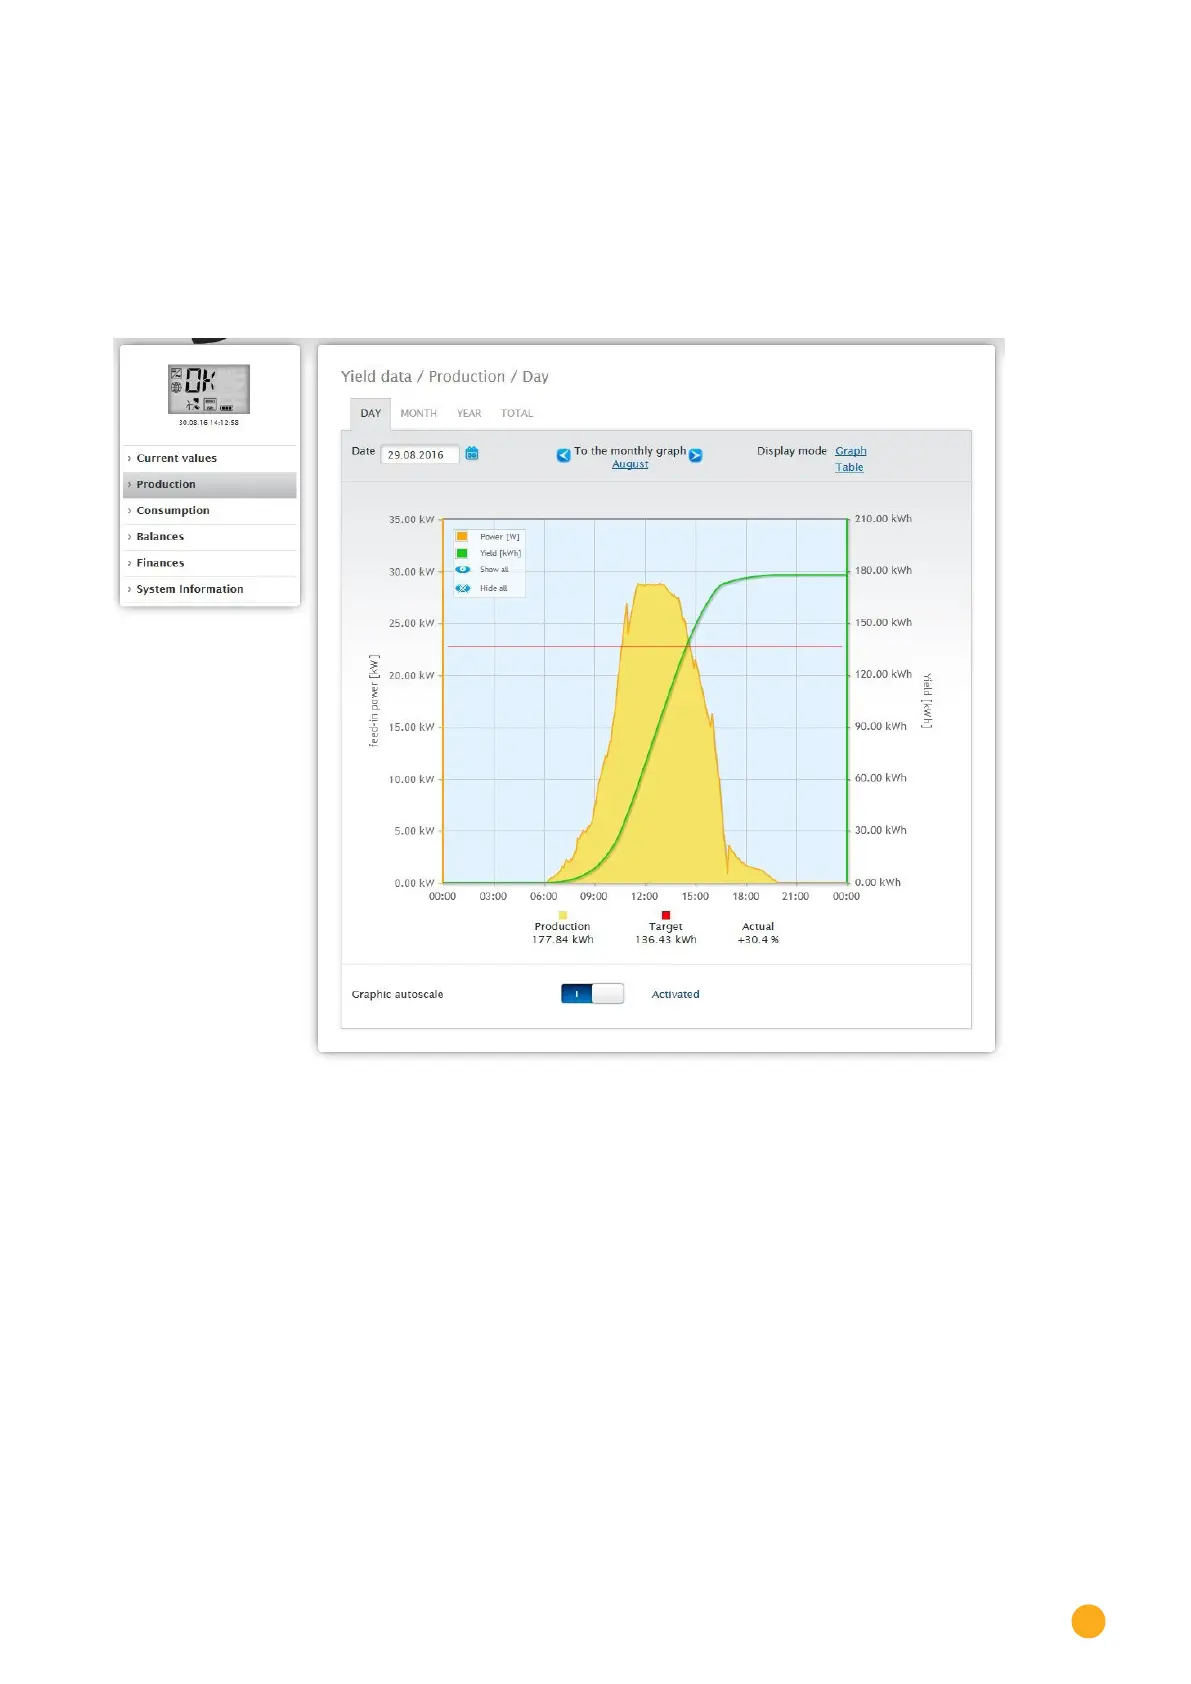
18.2.1 Day view
The Day tab displays the current day as a curve graph. The values Output (W) and Yield (kWp), on the
top left of the diagram key, can be selected and deselected at anytime with a left-click to display individual
values (curve) or to display or hide all values (curves). With a right-click, all of the values (curves) other
than the one selected can be hidden.
The different values throughout the day can be displayed by moving the mouse along the curve.
Fig.: Daily View of the Production Graph with the Auto Scaling activated
The following data is graphically displayed in the production day:
•
Production (kWh) (If the daily yield value is modified with the data correction function, the modifi-
cations are displayed in brackets.)
•
Target (kWh)
•
Actual (%):