247
Accessing Yield Data
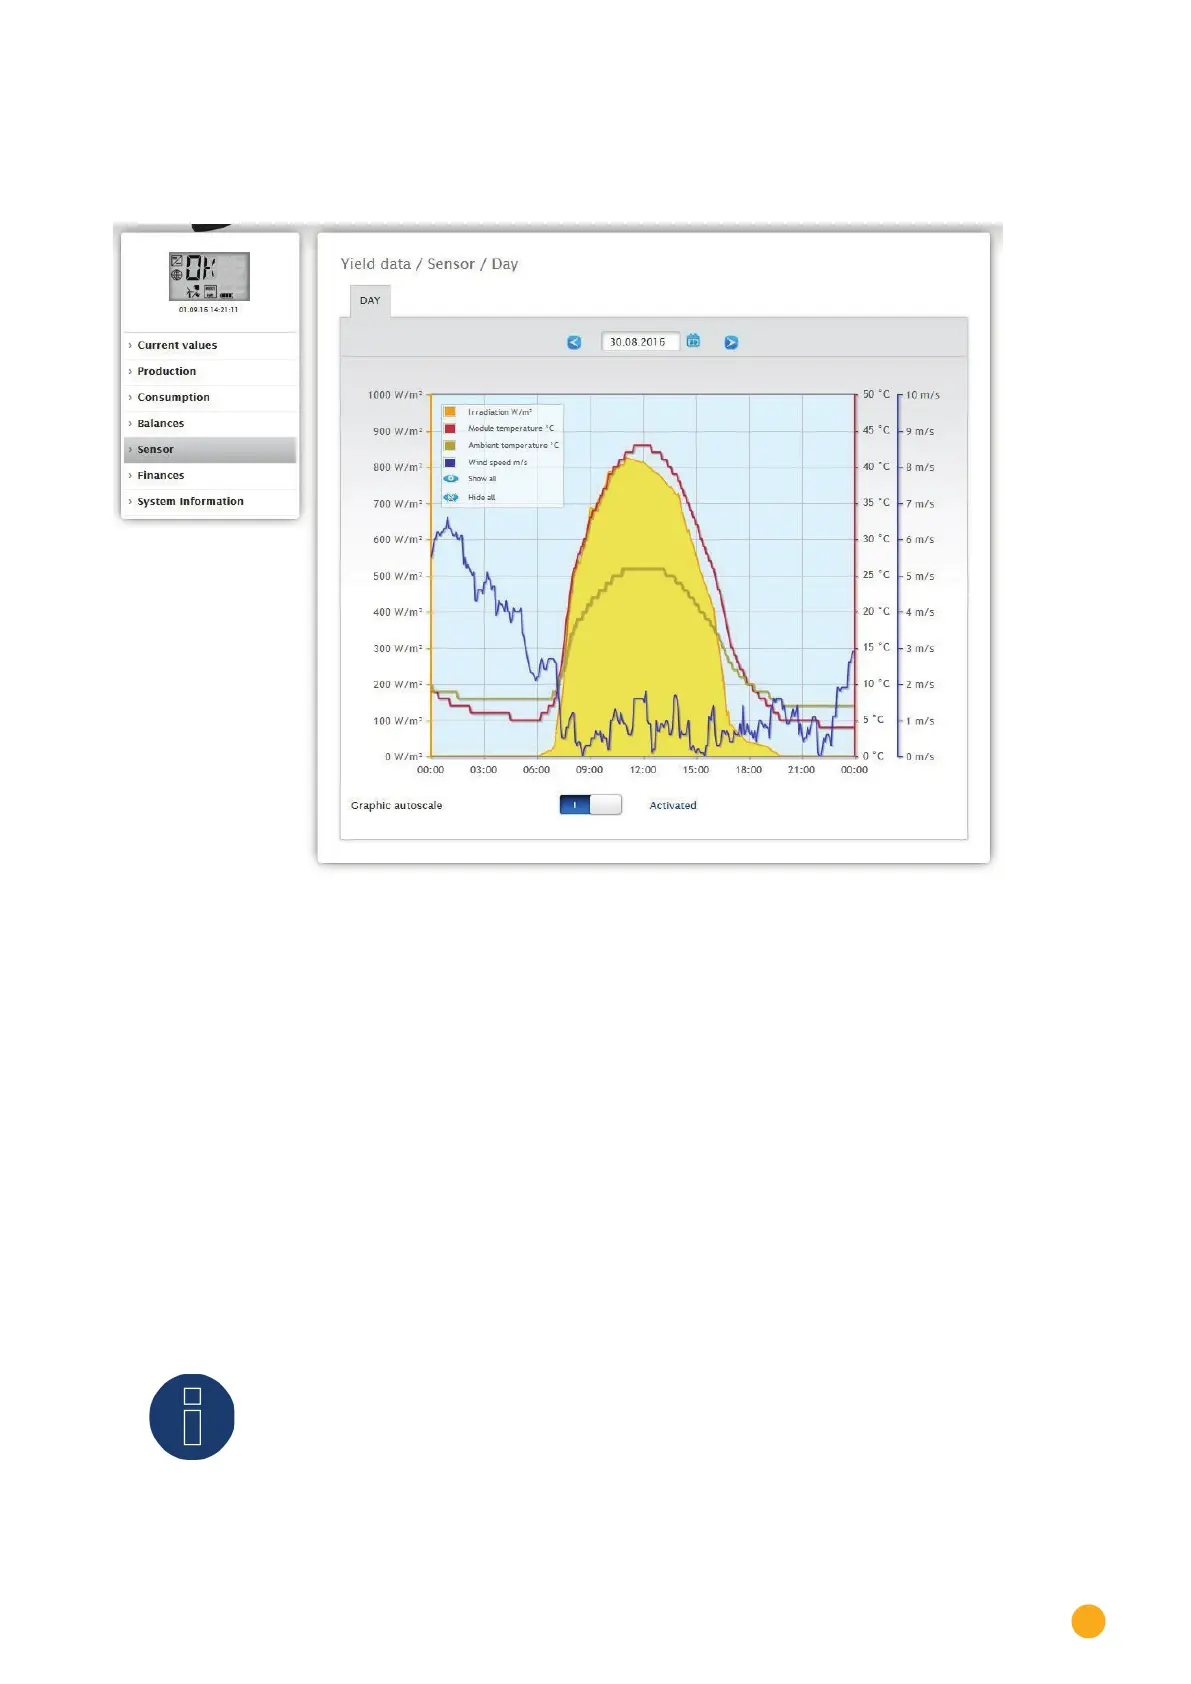
18.6 Sensor (only when a sensor is connected)
A graphic evaluation from the connected sensors can be displayed from the Senor menu.
Fig.: Graph of Sensor Box values
The following values can be displayed individually:
•
Irradiation W/m
•
Module temperature C°
•
Ambient temperature C°
•
Wind speed m/s
Different values with different units are displayed in the graph. The units used and their colors are display-
ed in the key at the top.
All of the values displayed can be selected and deselected at anytime with a left-click to display individual
values (curve) or to display or hide all values (curves). With a right-click, all of the values (curves) other
than the one selected can be hidden.
You can select and subsequently evaluate certain days with the Date box.
Note!
The menu is only visible once a meter is connected.