82
Installation
14.6.2 Explanations of the names in the main menu
Header bar
The header contains three main sections:
•
Yield data:
Here you will find your plant’s yield overview within certain periods of time such as day, month,
year and the total yield to date.
•
Diagnostics:
Here you can view the fault and process messages while filtering them according to specified crite-
ria.
•
Configuration:
Here you can change the device settings as required.
Left-side navigation menu
Depending on the tab selected, you can access additional functions from the navigation menu (left-side).
Tabs
Additional configuration sections appear according to the function selected.
Configuration Page
Here you can make necessary configurations for the optimal monitoring and evaluation of your plant. You
can also view information on the power output, yields and the device.
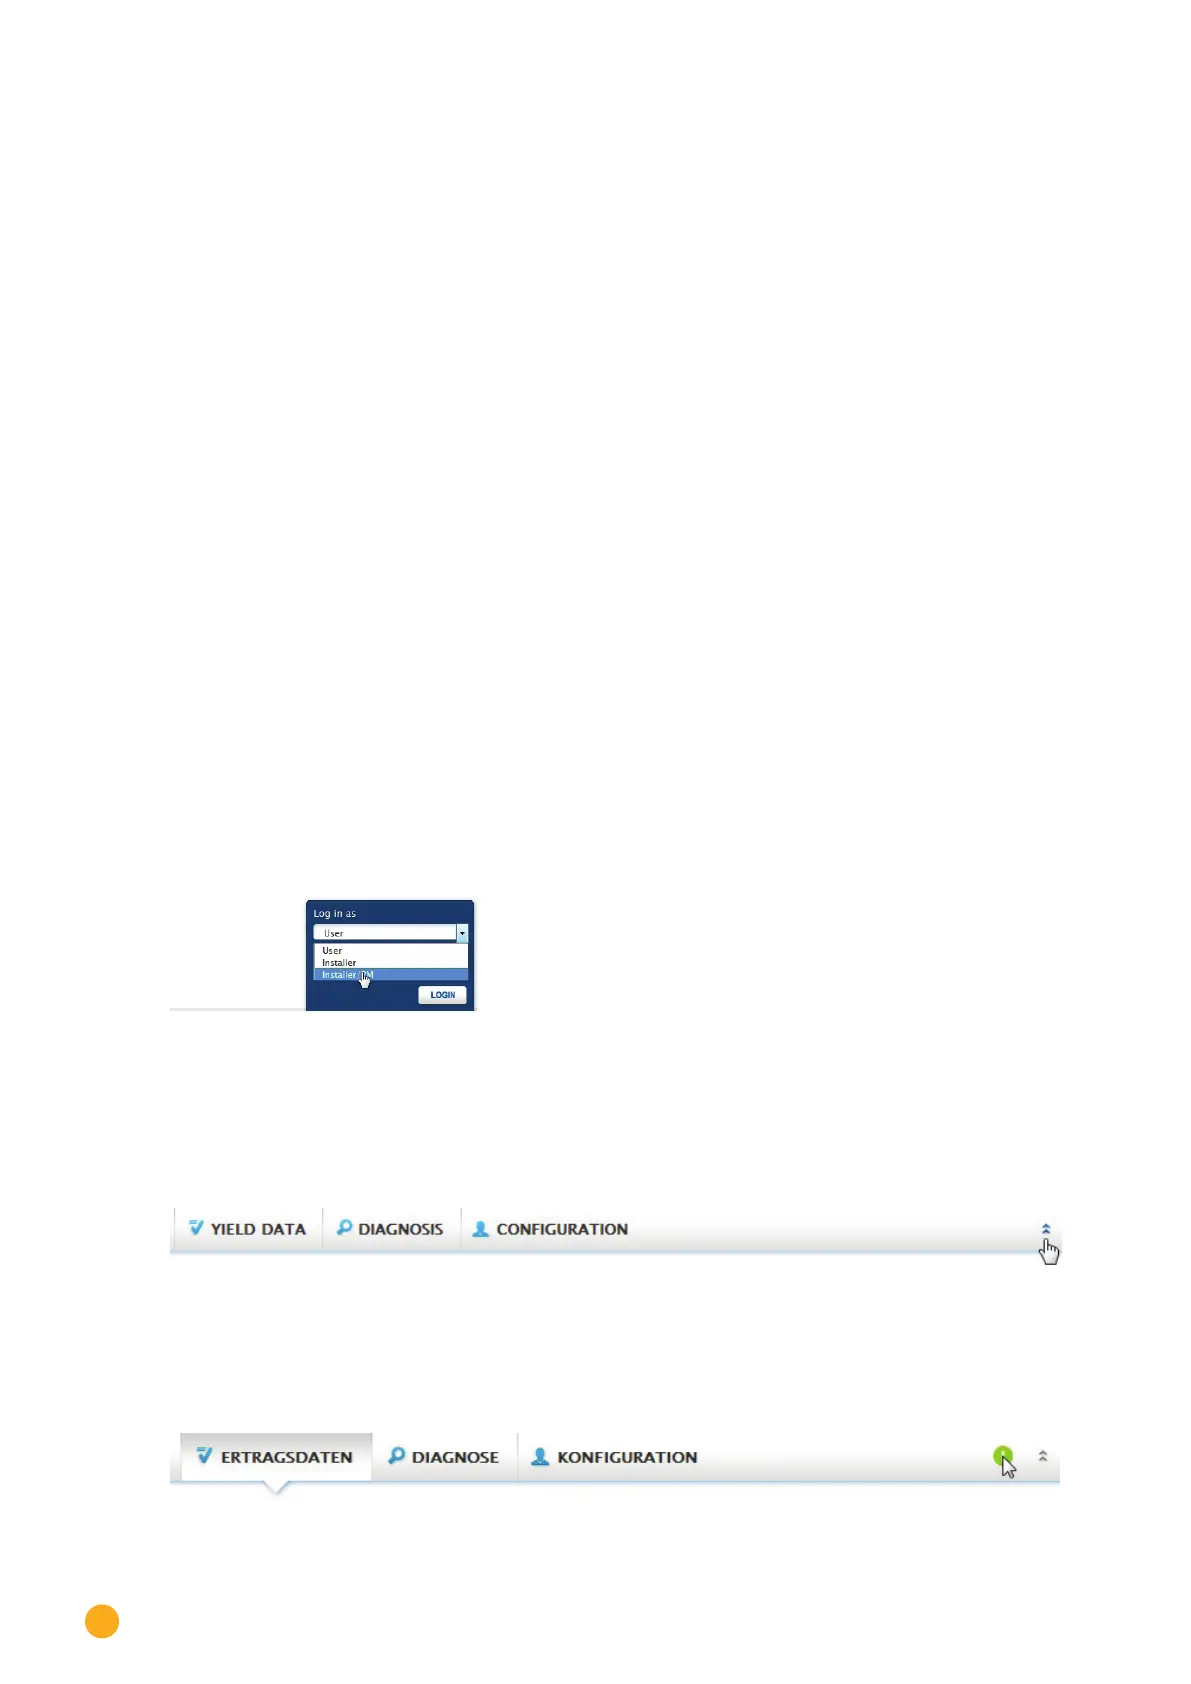
Log in button
You can entered a password protected section by clicking on the log in button (at the bottom right corner
of the screen) and entering your user and password. On the right side on the bottom, there is a blue line
next to the log in button which indicates if you are logged in and with which user level. (Refer to the Ac-
cess Control
section for more information)
Fig.: Log in button with selection box
Hide arrow
The “Hide Arrow” (on the right of the header bar) allows you to increase the amount of the page displayed
in the browser by hiding the Welcome header.
Fig.: Header bar with the “Hide Arrow”
New Firmware
A notification is sent via the Web browser when a new firmware is version available; a green triangle with
an exclamation mark is displayed at the top in the status line. (See illustration: Signal for new firmware)
Fig.: Signal for new rmware