226
Accessing Yield Data
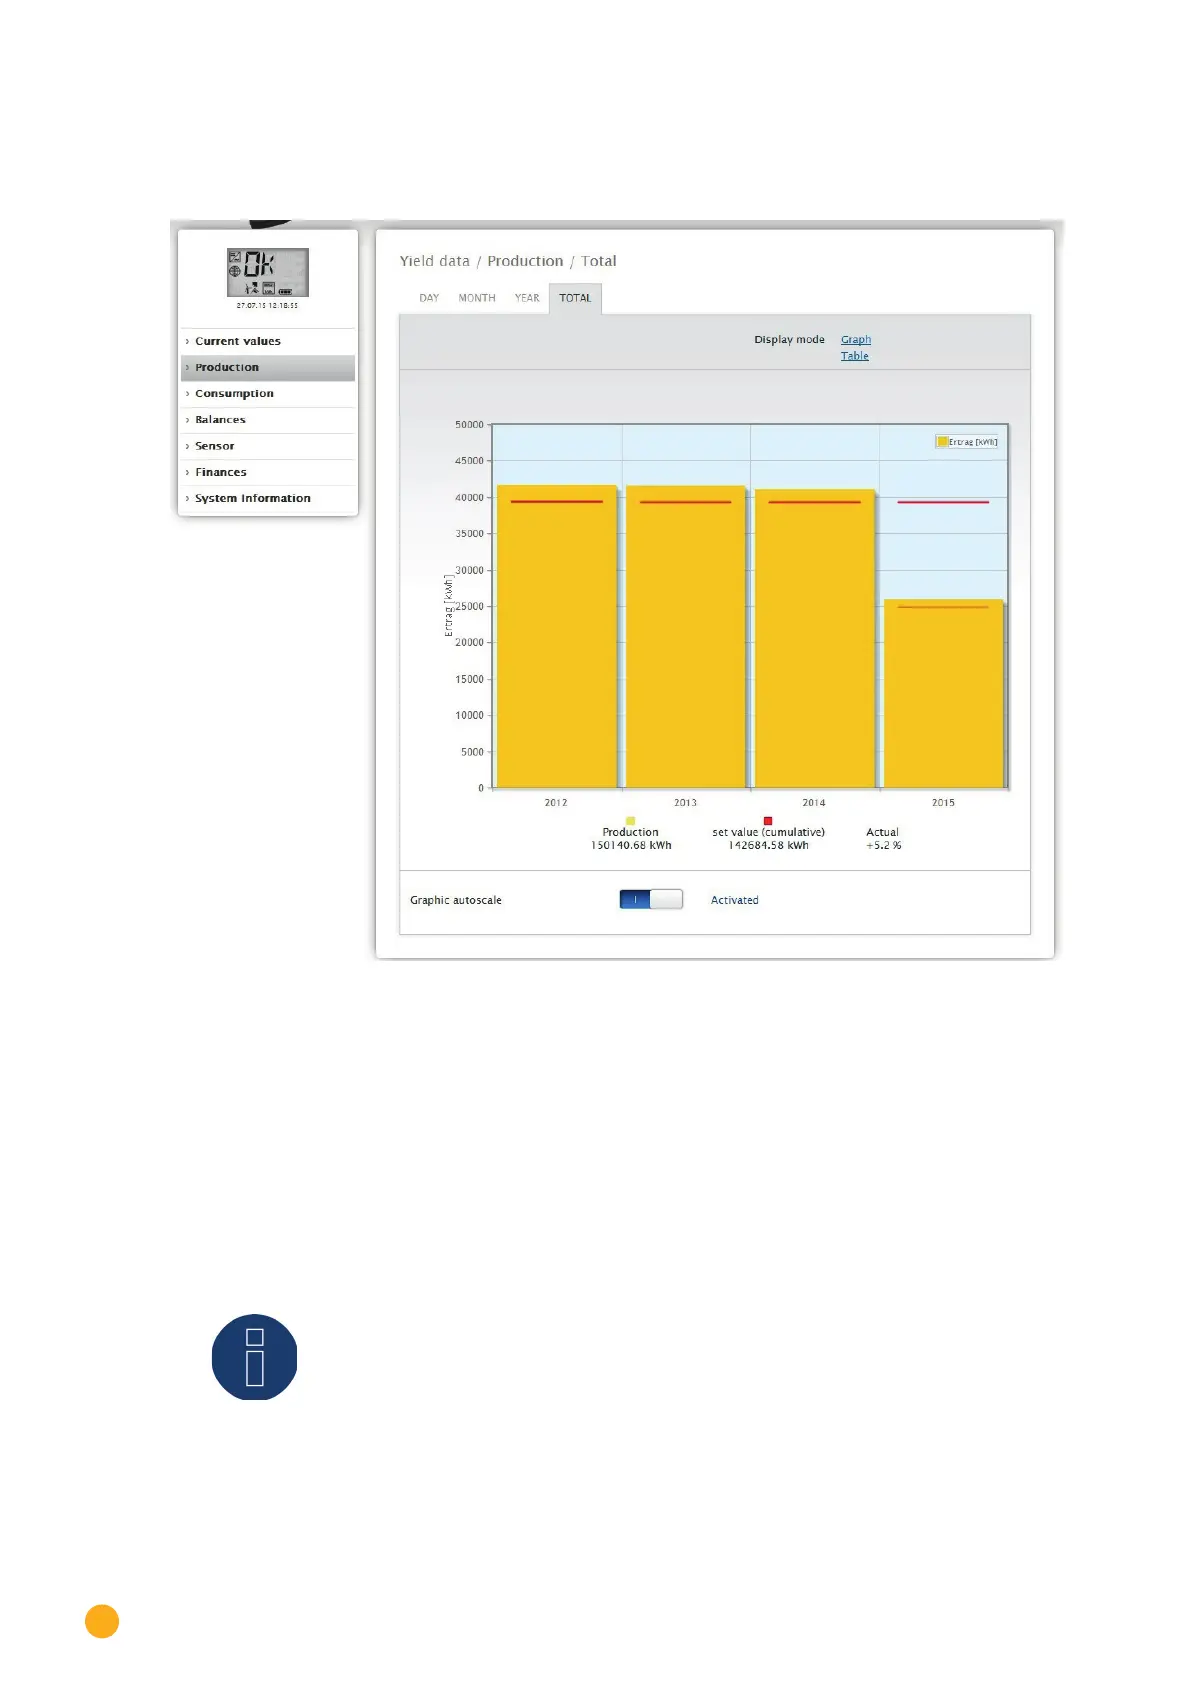
18.2 Production
You can select a graphic display of your plant’s production from the Production menu.
Fig.: Graphic display of the plant’s total production
From this display, you can select the following tabs:
•
Day
•
Month
•
Year
•
Total
You can select to display the view as a graph or table. The values displayed in the graph or table depend
on the view selected.
Note
The auto scaling option always scales the graphics up as much as possible. The
auto scaling can be manually disabled for the respective graphics. Then the scaling
is done based on the value defined in the device configuration. Please refer to the
the chapter on configuring inverters in the Installation Manual.
The selected section can be enlarged by clicking on the graphic and dragging it.