SVAN 948 USER MANUAL _
5 - 4
Selection of the scale in graphical results presentations - DISPLAY SCALE
The DISPLAY SCALE (path: MENU / DISPLAY / DISPLAY SETUP / CHANNEL x / DISPLAY SCALE)
sub-list enables the user to change the scale in the available modes of graphical presentation of the
measurement results (time history in the PLOT and so-called spectra in the SPECTRUM). It is possible to
change the scale of the vertical axis only. In order to enter this list one has to press the <ENTER> push-
button on the inversely displayed DISPLAY SCALE text of the DISPLAY SETUP sub-list. The
DISPLAY SCALE sub-list is closed and the instrument returns to the DISPLAY SETUP sub-list after
pressing the <ESC> push-button, which ignores any changes in the positions of the sub-list or the
<ENTER> push-button, which confirms the changes.
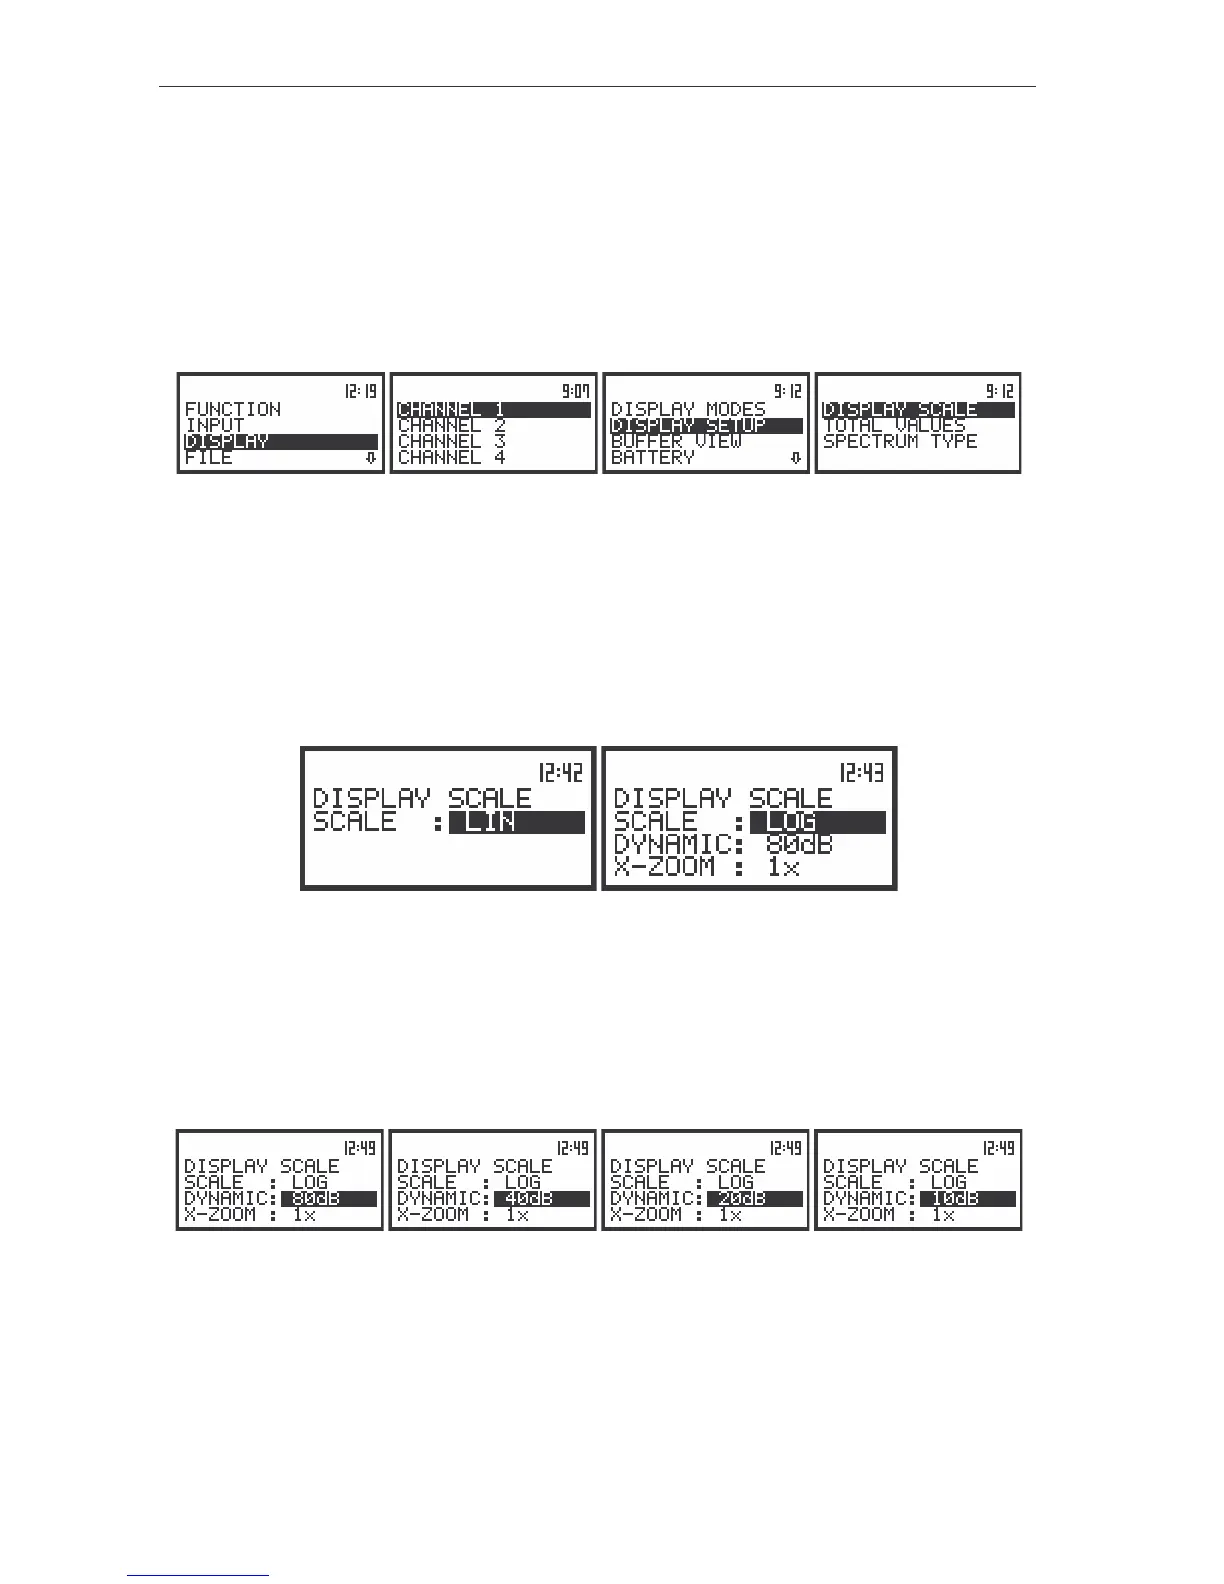
The view of the display with the DISPLAY list, the DISPLAY SCALE text highlighted
This position can be active only in the case of vibration measurements (when in the MODE sub-list
the VIBR. METER is selected). Two options are available: LIN (linear) and LOG (logarithmic). In the case
of the first one the graphical presentation and the units both are linear. In the latter case the graphical
presentation is given in the logarithmic scale and the measurement results are expressed in decibels (the
result is related to the values set in the REFERENCE LEVEL). It is possible to set the required option
using the <
>, <
> push-buttons. The confirmation of the selection is made by pressing the <ENTER>
push-button. The return without taking into account any change is made after pressing the <ESC> push-
button.
The view of the displays with the possible options of the VIBRATION SCALE
Scaling of the vertical axis of the graphical presentation - DYNAMIC
In the case of the vertical axis the user can obtain the double, four times and eight times expansion
(as the default the vertical axis corresponds to 80 dB, after expansion it corresponds to 40 dB, 20 dB and
10 dB – respectively) using the <
>, <
> push-buttons. This setting is always valid only for the
measurements of sound and for vibrations if the LOGarithmic scale was selected.
The view of the displays with the possible values of the vertical axis in PLOT and SPECTRUM presentations
Scaling of the horizontal axis of the graphical presentation - X-ZOOM
It is not possible, up to the version 4.05 of the internal software, to change by means of the <
>,
<
> push-buttons the horizontal axis (the default value of the multiplier of this axis is equal to 1).