SVAN 948 USER MANUAL
4 - 49
4.4.2. 1/1 OCTAVE analyser of vibration signal
In order to select the instrument’s acoustic mode the user has to enter the CHANNELS SETUP list
by pressing the <MENU> push-button, selecting by means of the <
>, <
> (or <
>, <
>) push-buttons
the INPUT text and pressing the <ENTER>, and then enter the CHANNELS SETUP the same way like in
previous and chose number of CHANNEL to configuration. In the MODE sub-list the user can select the
kind of input signal which has to be measured or analysed by the instrument. In the case of acoustic
signals the VIBRATION METER option should be selected Then by pressing <
>, <
> push-buttons
user has to change VIBR. mode and press the <ENTER> push-button, which closes the MODE sub-list.
The MODE sub-list is closed ignoring any changes made in it, after pressing in any time the <ESC> push-
button.
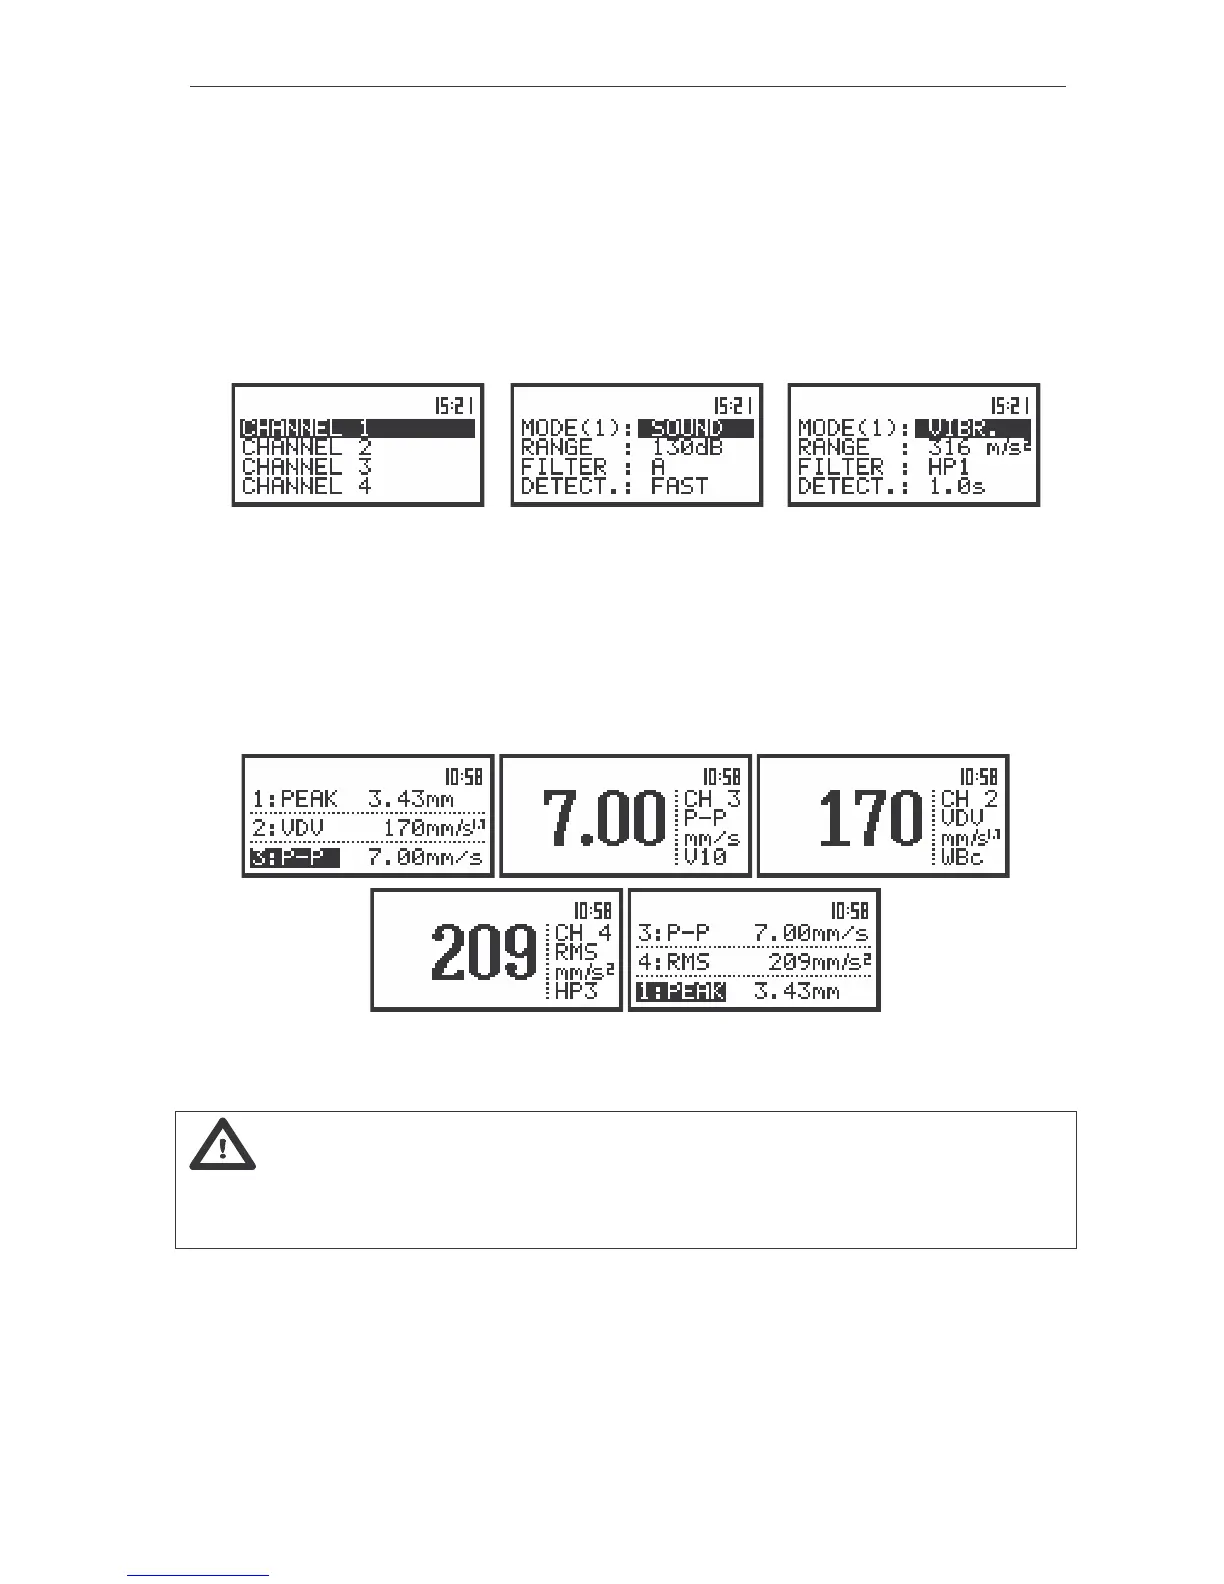
a)
b) c)
The view of the displays in the CHANNEL x (path: MENU / INPUT) list with the CHANNEL x text selected (a);
the SOUND METER mode selected (b) and the VIBR. METER mode selected (c)
In 1/1 OCTAVE analysis the spectrum is available in parallel to the VLM operation. All 15 digital
pass-band filters (with the centre frequencies from 16 kHz down to 1 Hz; in base-two system) are working
in the real time with the linear RMS detector displayed in the SPECTRUM sub-list of the
1/3 OCTAVE SETUP. In order to inform the user about the working mode of the instrument, in one profile
and 3 PROFILES modes of result’s presentation the doted line are used for the indication that the
instrument do not work in the VLM mode. In the VLM mode the continuous lines are used.
The view of the displays in one profile and 3 PROFILES result’s presentation mode with the doted lines
indicating that the instrument do not work in the VLM mode
Note: The TOTAL RMS result is measured with the HP weighting filter and takes no account
of the VLM profile settings. The spectra are always linearly averaged. Thus, the TOTAL value from
1/1 OCTAVE analysis can differ from those obtained in the VLM profiles (if the RMS INTEGRATION is set
to EXPONENTIAL).
In order to change the mode of the measurement results presentation the user has to press the
<
> or <
> push-buttons. The following modes are available:
One profile, 3 PROFILES, SPECTRUM and PLOT.