SVAN 948 USER MANUAL
4 - 15
Presentation of time history - PLOT
The PLOT mode of results presentation is available if data from at least one channel are logged in
the buffer’s file. If the BUFFERS position in BUFFERS SETUP sub-list is switched ON but in the selected
channel there was nothing switched on ([√
√√
√]), the NO RESULTS text is displayed after the first input to this
mode (see Figure below). When the BUFFERS is selected as non-active BUFFER:OFF and it is set for all
channels, the PLOT mode of results presentation is skipped.
The results are presented in the PLOT display, when the BUFFERS position is switched ON and
the user selected position to be displayed in the BUFFERS SETUP/ CHANNEL x ([√
√√
√])
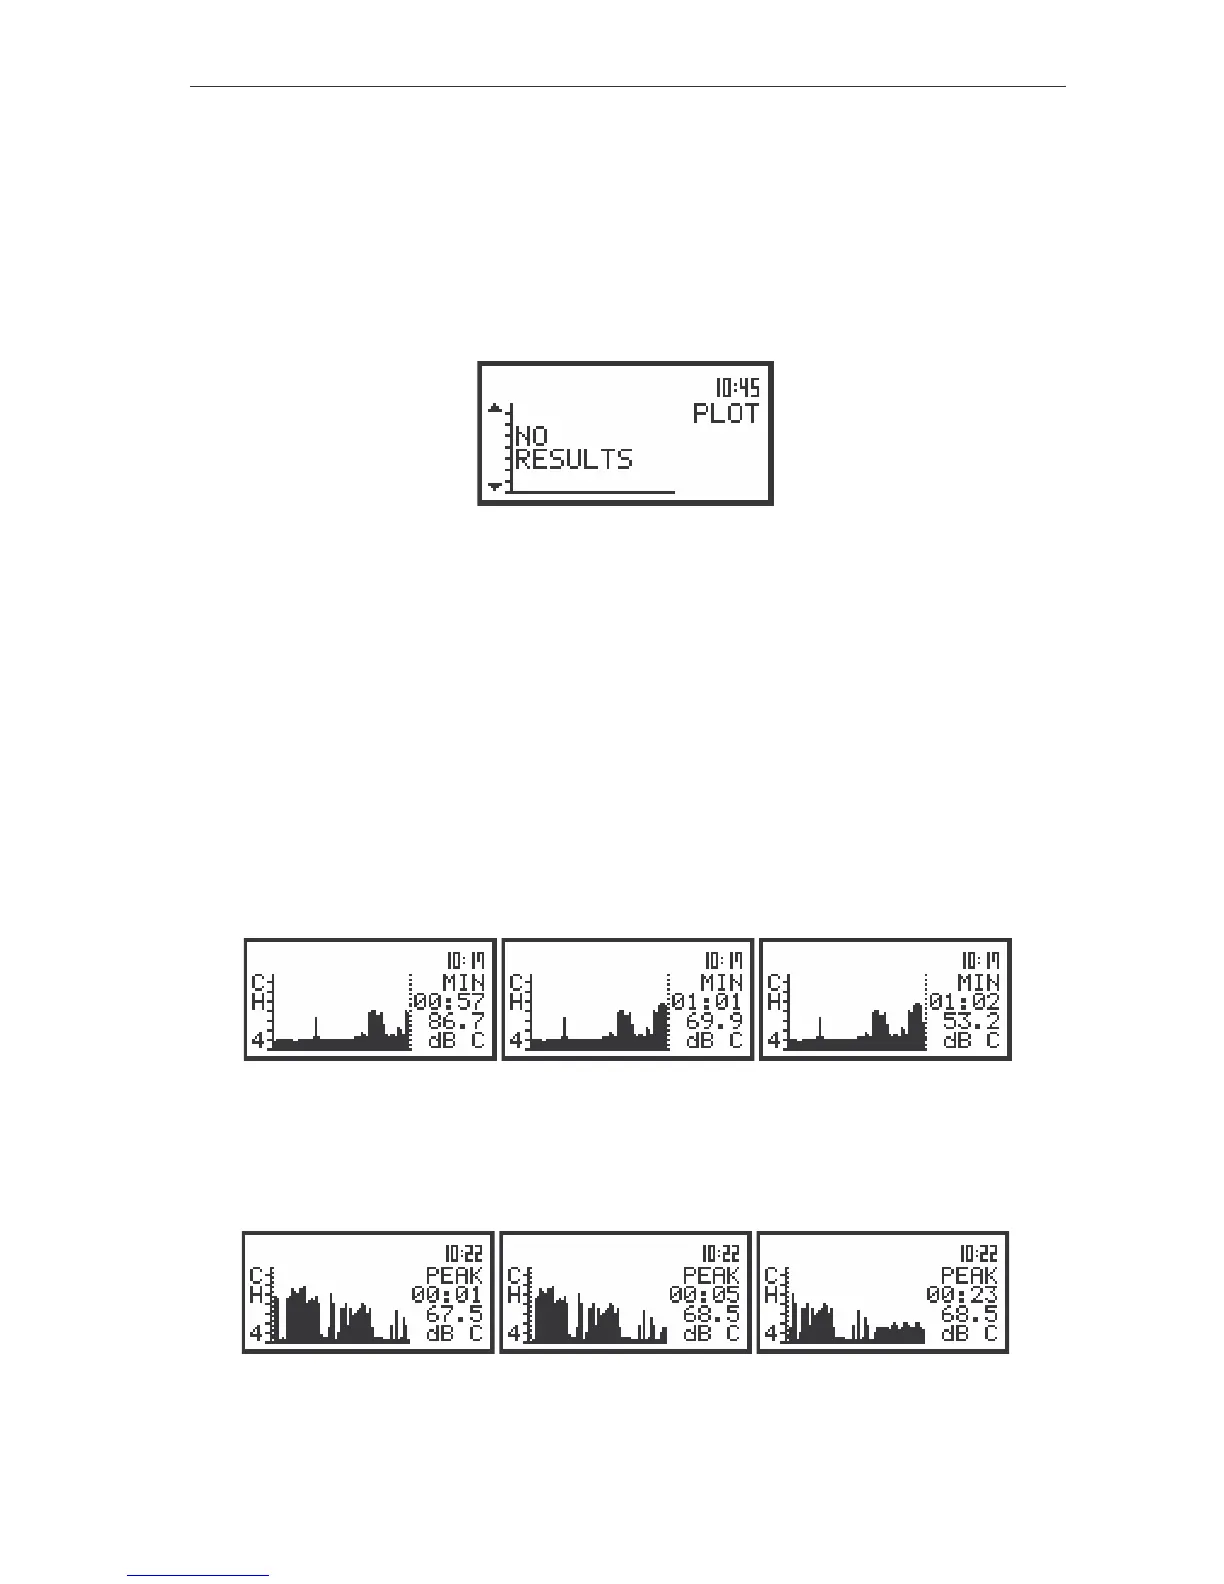
The view of the display in the PLOT mode when there is nothing in the buffer to be displayed (after setting
PLOT as active)
In the PLOT presentation the results logged in the file of the buffer of the instrument are also given
on the display in the time history form. Each line corresponds to one measurement result (the results are
registered with the step set in the BUF. STEP position of the MEASURE SETUP sub-list (path: MENU /
INPUT / MEASURE SETUP / BUF. STEP). There are 57 lines presented on the display with the dynamics not
greater than 80 dB.
The read-out of the interested value can be done using the cursor controlled by the <
>, <
>
push-buttons. The selected channel’s number is presented on the left side of the display. Time of the
measurement and the measured result with its unit are presented on the right side of the display. Each
new measurement result saved in the file of the buffer during the PLOT mode shifts the cursor position to
the right. When the cursor achieved the right limit of the display, new measurement results appears on the
right end of the display and the results from 58*BUF. STEP disappears from the left end of the display. It
looks like the movement of the presentation to the left. The display is updated every BUF. STEP time for
the BUF. STEP greater than or equal to 1 second and every second for the BUF. STEP smaller than
1 second.
The displays in the PLOT presentation mode; the overview of the values later stored in the buffer
After finishing the registration it is possible to overview all saved results. For this reason the cursor
has to be placed to the left or right limit of the presentation. Each pressing of the <
>, <
> push-buttons
results in the appearing of the display, respectively - the earlier or later value. The whole presented time
history is shifted one position to the right (or to the left).
The displays in the PLOT presentation mode; the overview of the values earlier stored in the buffer