SVAN 948 USER MANUAL .
4 - 12
Notice: The PEAK result never depends on the detector time constant. The results LEQ,
SEL and Ld(en) do not depend on the detector time constant if in the RMS INTEGRATION position of the
SETUP list the LINEAR option was selected. The results LEQ, SEL and Ld(en) depend on the detector
time constant if in the RMS INTEGRATION position of the SETUP list the EXPONENTIAL option was
selected.
For each of the channels (three independent measurement modules) the following results are
measured in parallel (see Appendix D for the definitions):
- PEAK,
- MAX,
- MIN,
- SPL (the displayed SPL value is the biggest measured result for the selected
RMS detector over the last second of the measurement),
- LEQ,
- SEL,
- Lden (depending on the period of the measurement d-day, e-evening, n-night
the different abbreviations of the function name are displayed),
- Ltm3,
- Ltm5,
- LN selected by the user statistics class (where N is from 1 to 99),
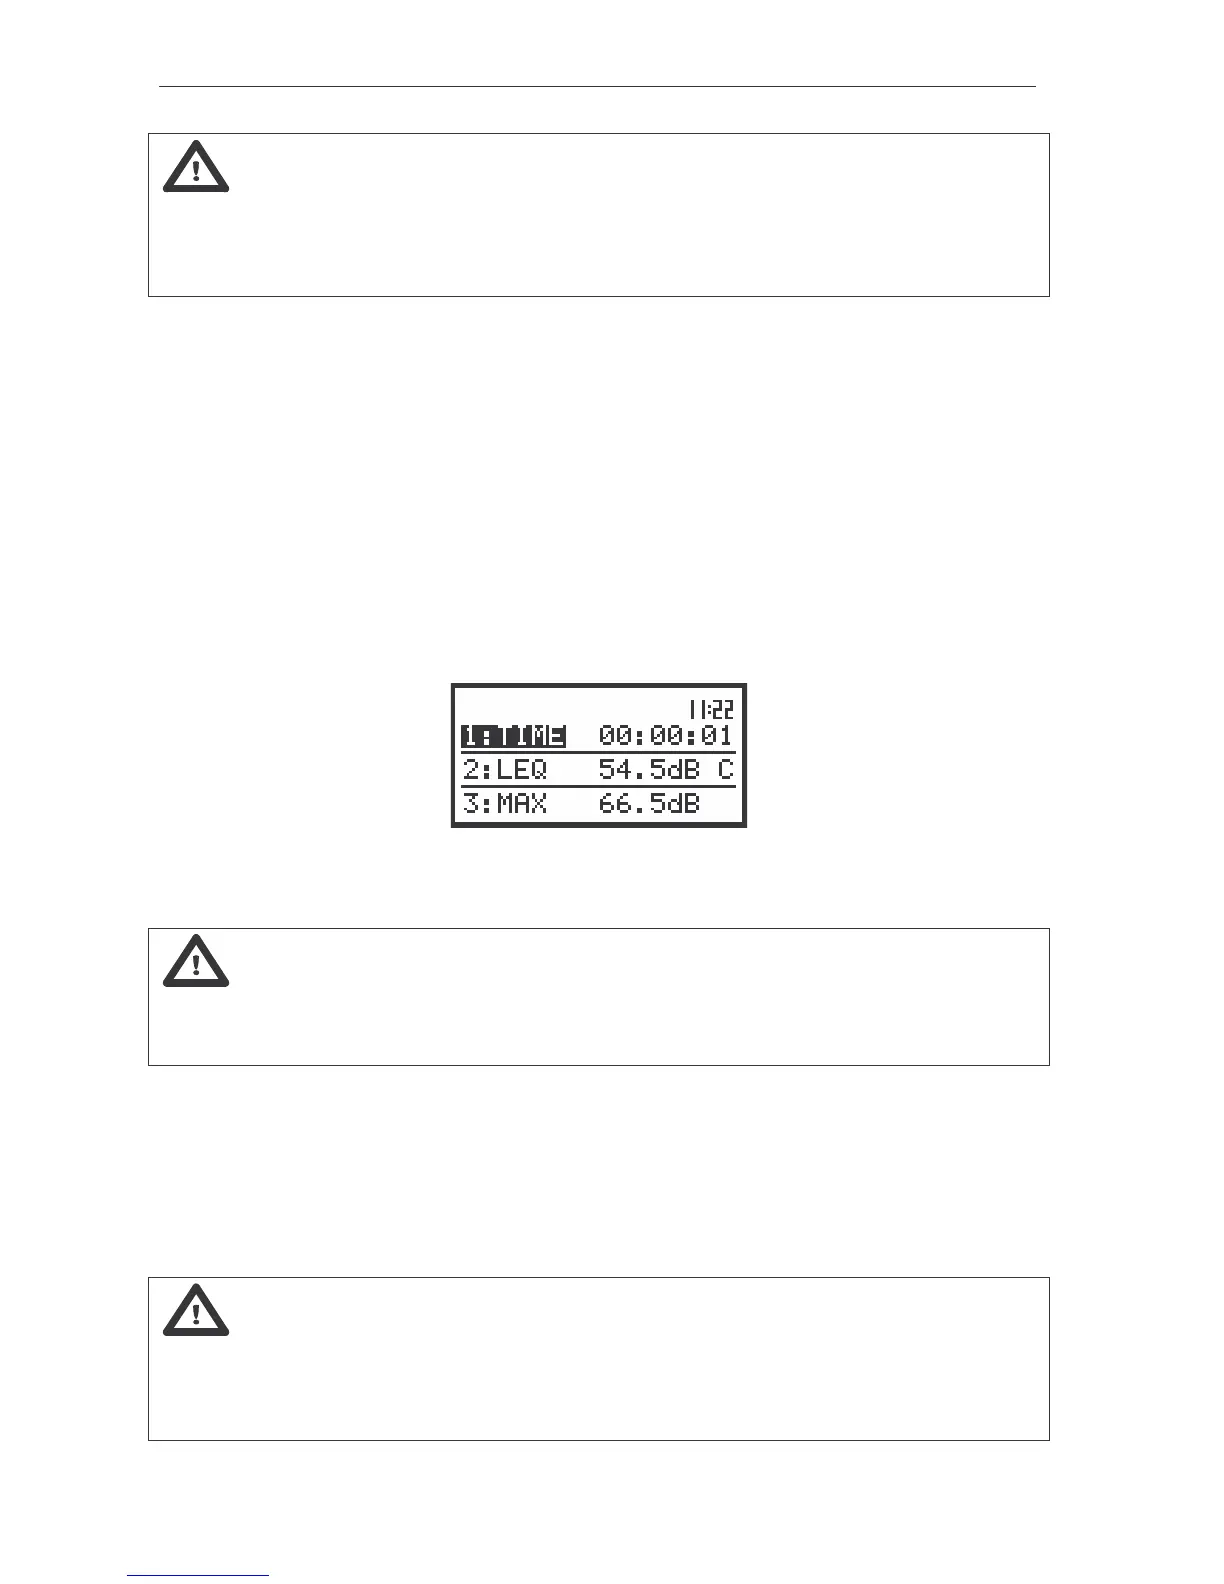
- Current measurement time (this time is available in the result’s field only in 3 PROFILES display
mode).
The view of the instrument’s display in 3 PROFILES display mode with the current measurement time for
CHANNEL 1 in SLM mode
Notice: Switching between the channels is possible by pressing the <SHIFT> with <
> or
the <SHIFT> with <
> push-buttons. Switching between the results for the selected channel is made by
pressing only the <
>, <
> push-buttons. In order to change the nn in statistical level the user has to
press the <
>, <
> push-buttons together with the <SHIFT> one (in one profile or 3 PROFILES mode).
By pressing the <
> or <
> push-button the user can switch the display mode (the way of the
measurement results presentation) to:
- One profile,
- 3 PROFILES,
- STATISTICS,
- PLOT (from the channels in which the results of the measurement were stored in the files of the buffer;
the number of the channel is displayed in this case along with the name of the result, i.e. CH 1 - PEAK,
CH 2 - RMS, CH 3 - MAX, etc).
Notice: The user can select the currently active mode of the result’s presentation by means
of the DISPLAY MODES sub-list of the DISPLAY list. The activation of a mode is indicated by the
graphical symbol placed in the proper line of the DISPLAY MODES sub-list. Below the view of the
displays is presented with all active modes ([
√
√√
√
]) and some of them switched off ([ ]). More details about
the display modes are given in the description of the DISPLAY list in the Chapter 5.